Introduction
A utilization report is one of the most powerful tools organizations use to monitor, optimize, and sustain high levels of business productivity. It provides leaders with a clear, data-driven view of how resources are allocated and highlights whether teams are over- or underutilized or operating at peak efficiency.
Without accurate insights into utilization levels, organizations risk missed deadlines, shrinking profit margins, employee burnout, and underperforming projects. With the right utilization reporting in place, managers can quickly identify resource-related inefficiencies, rebalance workloads, improve project delivery, and ultimately drive higher revenue.
In this blog, we’ll explore everything you need to know about utilization reports, what they include, why they matter, and how to build one effectively using modern resource management software.
What is a Utilization Report?
A utilization report is a detailed document that measures how effectively an organization’s available resources are used across projects and tasks over a specific period of time. It enables managers to gain insights into how time is allocated between billable (revenue-generating) and non-billable (administrative) activities.
This visibility helps organizations identify instances of underutilization and overallocation, enabling them to take proactive measures to optimize resource workloads and boost business productivity.
Now that we know what is a utilization report, let’s move on to the benefits of implementing and using it effectively.
Key Benefits of Using a Utilization Report
Utilization reports matter because they directly influence business profitability, delivery reliability, and workforce sustainability. The following are the other rewarding benefits a utilization report provides:
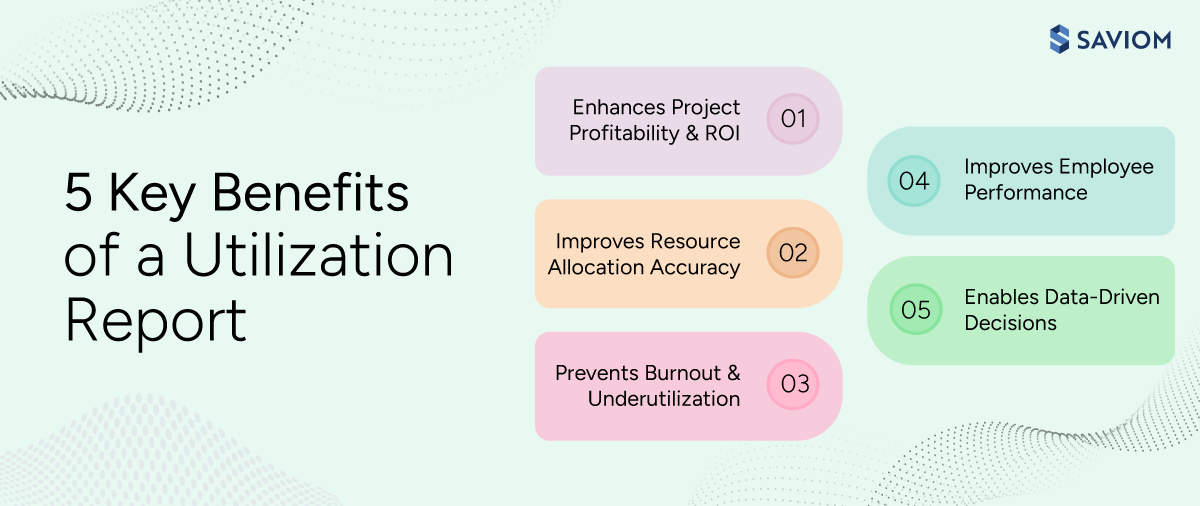
Enhances Project Profitability and ROI
A utilization report enables organizations to identify patterns of resource underutilization and overload. These insights help managers ensure that more time is directed toward revenue-generating activities rather than non-billable or low-value tasks. As a result, organizations can boost profitability and strengthen overall ROI.
Improves Resource Allocation Accuracy
By showing which resources are available, overbooked, or underutilized in real time, these reports enable managers to assign work based on actual capacity, availability, and skill rather than assumptions. This reduces delivery delays, avoids increased bench time, and ensures resources are deployed where they create the most impact.
Prevents Burnout and Underutilization
When organizations consistently monitor utilization data, they gain early insights into workload imbalances across teams. It highlights overutilized employees at risk of burnout and underutilized resources, both of which impact ROI. With these insights, managers can proactively rebalance workloads, optimize employee productivity, and ensure on-time project delivery.
Explore how workforce planning prevents employee burnout down the line.
Improves Employee Performance
When workloads are distributed based on actual resource capacity, availability, skills, and competency, employees can focus on work aligned with their strengths. This enables them to operate more efficiently, maintain better focus, boost performance, and achieve peak productivity levels.
Enables Data-Driven Decisions
A robust utilization report provides clear foresight into the resource utilization levels, helping managers understand where capacity is over- or underutilized. This allows leaders to make informed, data-driven decisions that help optimize resource utilization and improve overall business profitability.
Discover how to make data-driven decisions with resource management software.
Now that we know the key benefits of a utilization report, let’s delve deeper into its distinct types in the next section.
Types of Utilization Reports
Different utilization reports provide different decision lenses, helping managers analyze resource performance and productivity at the right level of detail.
The most common types of utilization reports include:
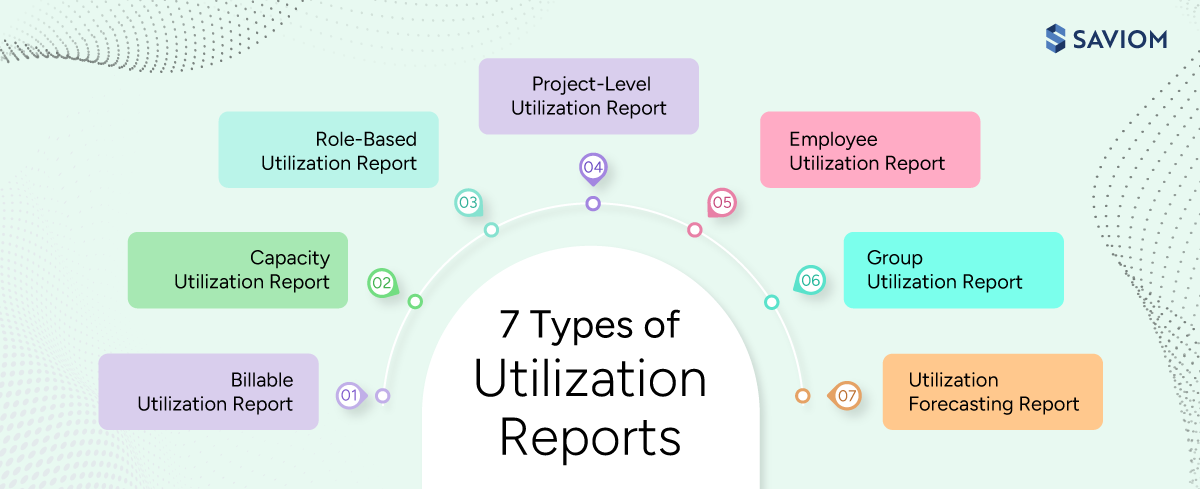
Billable Utilization Report
A billable utilization report tracks the total time spent on client-facing, revenue-generating work to assess how effectively billable resources contribute to financial outcomes. This report is especially critical for consulting, IT services, and professional services firms where revenue depends heavily on billable utilization.
Explore 5 effective ways to maximize billable resource utilization in professional services firms.
Capacity Utilization Report
A capacity utilization report compares total available capacity against current and upcoming demand to identify potential resource shortages or excesses before delivery is impacted. It supports informed resourcing decisions around hiring, reskilling, outsourcing, or reprioritization for successful project delivery.
Role-Based Utilization Report
A role-based utilization report evaluates how specific roles or skill sets are used across the organization. It highlights role-specific workload imbalance, capability gaps, and underutilized expertise, supporting informed workforce planning and long-term skill development.
Project-Level Utilization Report
The project-level utilization report shows how resources are utilized within individual projects, allowing managers to track actual effort against planned allocations. Moreover, it helps them identify variances in resource utilization levels and workload distribution that can affect project timelines, budgets, and delivery quality.
Dig deeper into how project resource management ensures consistent project delivery.
Employee Utilization Report
An employee utilization report provides explicit individual-level visibility into how their time and efforts are spent across billable and non-billable tasks and projects. This report supports balanced task allocation, thereby boosting employee productivity and maximizing overall ROI.
Group Utilization Report
The group utilization report highlights utilization levels across teams or departments. The data helps managers determine whether groups are optimally utilized relative to their capacity or availability. Accordingly, managers can implement necessary measures to maintain a balanced workload distribution and boost productivity.
Utilization Forecasting Report
Utilization forecasting reports estimate future resource usage based on current trends. With this foresight, businesses can better plan and allocate resources for upcoming projects, reducing the risk of over- or underutilization and maximizing workforce efficiency.
With an understanding of the different types of utilization reports, let’s explore the critical elements they include to give accurate results.
Core Components of a Utilization Report
A utilization report is only as effective as the data structure behind it. These components ensure accuracy, context, and decision readiness.
Project Details
A utilization report includes project details such as the name, code, client name, start and end dates, and other relevant specifics. This data helps identify and track how employees are utilized across different types of work, including internal and external projects or BAU activities.
Employee Information
This component includes employee details such as roles, skills, team alignment, department, and other relevant attributes. This information helps managers assess individual performance and productivity, supporting informed decisions on performance appraisals, identifying areas for improvement, and facilitating strategic workforce planning.
Time Period
In a utilization report, the time period refers to the specific duration, such as weekly, monthly, or quarterly. This component allows managers to assess resource utilization within that specific timeframe and optimize it as needed, maximizing organizational efficiency.
Allocated vs. Actual Hours
A utilization report also includes allocated hours and the actual time spent by the resources on the tasks. Using this information, managers can take data-driven decisions to improve forecasting accuracy, optimize workload distribution, and improve delivery performance.
Explore the comprehensive guide on resource forecasting to ensure successful project delivery.
Productivity and Utilization Metrics
Utilization and productivity metrics provide insight into each employee’s efficiency in accomplishing tasks that contribute to organizational goals. They provide a clear view of billable, non-billable, and total utilization for teams or individuals, helping firms optimize resources and improve overall cash flow.
Utilization Benchmarks and Targets
Utilization benchmarks provide a reference point for evaluating whether resource usage is balanced, healthy, and sustainable. They help distinguish between optimal utilization and overutilization or underutilization, enabling more balanced workload management and driving long-term workforce sustainability.
Explore this eBook to learn how a 5th gen resource management helps firms optimize resource utilization and enhance project profitability.

Let’s jump into the next section, encapsulating how to create a resource utilization report in 8 easy steps.
How to Create a Utilization Report? (Step-by-Step Process)
Creating a utilization report is not about assembling data; it is about building a decision-ready framework that helps you maintain an optimal resource health index and drive consistent project success. Here’s how you can get started:
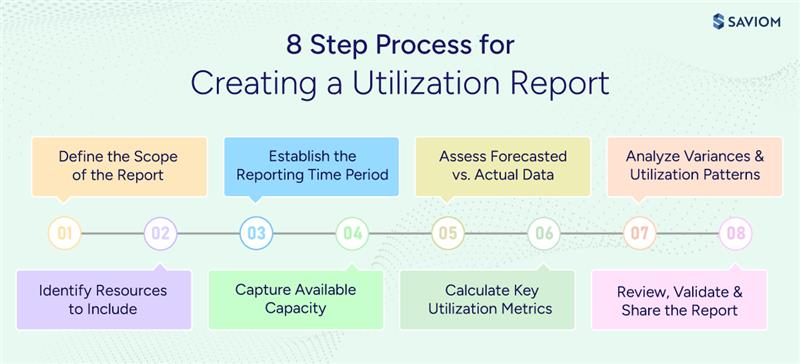
Step 1: Define the Scope of the Report
The first step is to clarify the purpose of the utilization report: whether it is intended for profitability tracking, workload balancing, or utilization forecasting. Clearly defining the scope helps ensure the report focuses on the metrics that support your intended outcomes while aligning with broader business priorities.
Step 2: Identify Resources to Include
The next step is to determine which employees, roles, teams, or departments should be included in the report. This also involves deciding whether to track billable, non-billable, or both resources. So, clearly defining the resources to include in the report ensures it remains focused, accurate, and relevant to its intended purpose.
Continue reading on the effective steps to do resource estimation.
Step 3: Establish the Reporting Time Period
Now, define a consistent reporting time frame based on the report’s objective: weekly for operational monitoring, monthly for performance assessment, or quarterly for strategic planning. A standardized reporting period enables meaningful trend analysis and reliable comparisons.
Step 4: Capture Available Capacity
At this stage, calculate available capacity by defining standard working hours while adjusting for holidays, planned leave, and non-working days. This step establishes a realistic baseline for measuring utilization. Without this, utilization values can appear misleading, resulting in poor staffing and workload decisions.
Continue reading on the effective steps to perform resource capacity requirement planning.
Step 5: Assess Forecasted vs. Actual Data
Next, compare forecasted hours from project schedules with actual hours recorded to identify how closely utilization levels align with forecasts. Ensuring data accuracy is critical here, as incomplete or delayed inputs compromise utilization insights and reduce overall efficiency.
Step 6: Calculate Key Utilization Metrics
This step involves calculating key utilization KPIs such as resource utilization rate, forecasted vs. actual utilization, billable resource utilization, etc. Together, these metrics provide a holistic view of how effectively the available capacity is being utilized, helping managers identify inefficiencies and improve resource allocation.
Explore the step-by-step guide to accurately track resource utilization.
Step 7: Analyze Variances and Utilization Patterns
Analyzing the gap between forecasted and actual utilization helps identify recurring variances across roles and teams. These patterns provide the insights needed to guide corrective measures such as resource reallocation, workload redistribution, targeted hiring, and capability building initiatives.
Step 8: Review, Validate, and Share the Report
Finally, validate the report by reviewing anomalies and contextualizing insights through discussions with relevant stakeholders. Present the findings in a clear, visual format to encourage understanding and smooth adoption. A well-validated utilization report serves as a reliable input for informed decision-making in resource planning.
Having explored the critical steps to build a utilization report, the following section discusses how to interpret utilization data correctly and translate it into corrective actions.
How to Analyze Utilization Reports to Improve Performance?
The correct analysis of utilization reports helps managers make informed resource decisions and maintain an optimized workforce. Let’s understand how to analyze one:
Establish Clear Utilization Benchmarks
Start by defining what optimal utilization looks like for your organization and different roles. Set realistic performance targets based on business goals, delivery models, and revenue expectations. Consequently, these benchmarks serve as reference points for evaluating whether resources are being used effectively.
Segment the Data by Role, Skill, and Department
Break down utilization data across roles, skill sets, and departments to gain comprehensive visibility. This helps managers understand which teams are consistently stretched and which have available capacity. Additionally, segmentation highlights patterns that may not be visible in overall numbers, supporting informed decision-making.
Distinguish Billable vs. Non-Billable Distribution
Evaluate how much time is spent on revenue-generating work vs. low-value tasks. If significant time is contributed to non-billable activities, such as ad-hoc projects or BAUs, it ultimately impacts overall business profitability. Thus, analyzing this distribution is critical to identify variances and take corrective steps to improve financial performance.
Continue reading to understand the difference between billable and non-billable work.
Identify Under- and Overutilized Resources Early
Analyze the report to spot resources that are either consistently overbooked or underallocated. Overloaded resources risk burnout and reduced productivity, while underutilized ones impact overall business efficiency. Hence, early identification allows managers to rebalance workloads before issues escalate, ensuring successful project delivery.
Compare Planned vs. Actual Utilization to Identify Variances
Analyze the actual resource utilization against what was originally forecasted. Any major gaps may indicate poor resource estimation, shifting priorities, or delivery risks. Hence, tracking this metric helps managers refine planning accuracy over time, thereby strengthening forecasting, improving delivery, and enhancing performance.
Gain real-time visibility into critical resource utilization metrics and ensure an optimized, healthy workforce using SAVIOM’s advanced resource management tool. Book a demo to see it in action.

Now, let’s understand how modern resource management software can help create utilization reports effectively and seamlessly.
How to Streamline Utilization Analysis with SAVIOM?
As organizations scale, utilization analysis becomes increasingly complex due to multiple projects, shifting priorities, and distributed teams. However, SAVIOM’s advanced resource management software simplifies this complexity by providing centralized utilization reporting that supports informed decision-making.
All-in-One Resource Planner
The tool offers an all-in-one resource planner that consolidates utilization data across projects, teams, roles, and departments into a single unified platform. This centralized view allows organizations to ensure consistency, accuracy, and real-time visibility for data-driven decision-making.
Visualize Utilization Levels Through Configurable Views
SAVIOM allows managers to analyze utilization data across multiple dimensions, such as location, role, team, department, project, or individual resource, so that stakeholders can access insights relevant to their responsibilities.
Moreover, they can configure the report in graphical, tabular, or combined format, offering both visual clarity and numerical accuracy. This enables managers to quickly assess granular utilization patterns and take timely corrective resourcing actions.
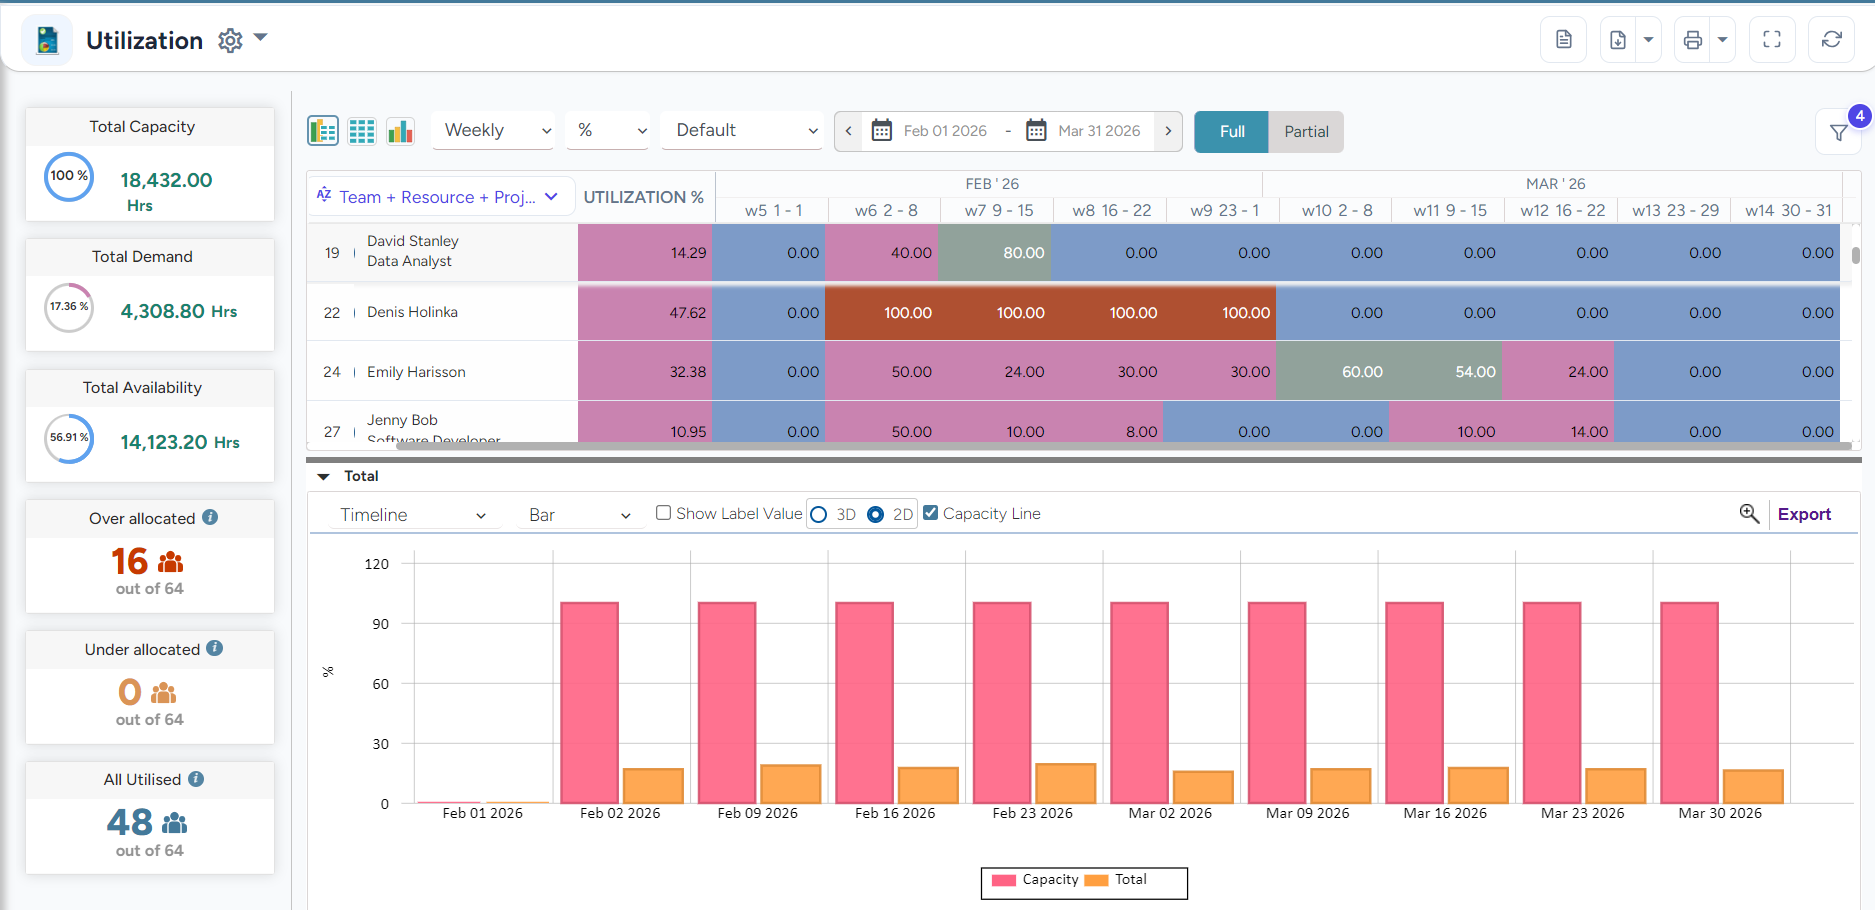 SAVIOM’s Utilization Report allows managers to customize and view data as per their business requirements.
Evaluate Resource Utilization Across Varied Time Periods and Units
SAVIOM’s modern resource management software supports enhanced utilization analysis across multiple timeframes and measurement units. This involves:
- Evaluating utilization data daily, weekly, monthly, or quarterly
- Seamlessly switching between different units such as Full-Time Equivalent (FTE), hours, days, or percentages
This flexibility allows leaders to analyze utilization from both operational and strategic perspectives, supporting more accurate resource planning and decision-making.
Color-Coded Heat Maps Highlight Resource Over- and Underutilization
The tool’s intuitive heat maps visually flag workload imbalances using color indicators, making utilization risks immediately visible. This data helps managers quickly identify over- or underutilized resources and take timely, targeted actions to balance current workloads and improve resource productivity across the teams.
Besides, the report includes summary stickers that highlight the following information, allowing managers to view all the data at a glance:
- Total capacity
- Total demand
- Total availability
- Overallocated resources
- Underallocated resources
- All utilized
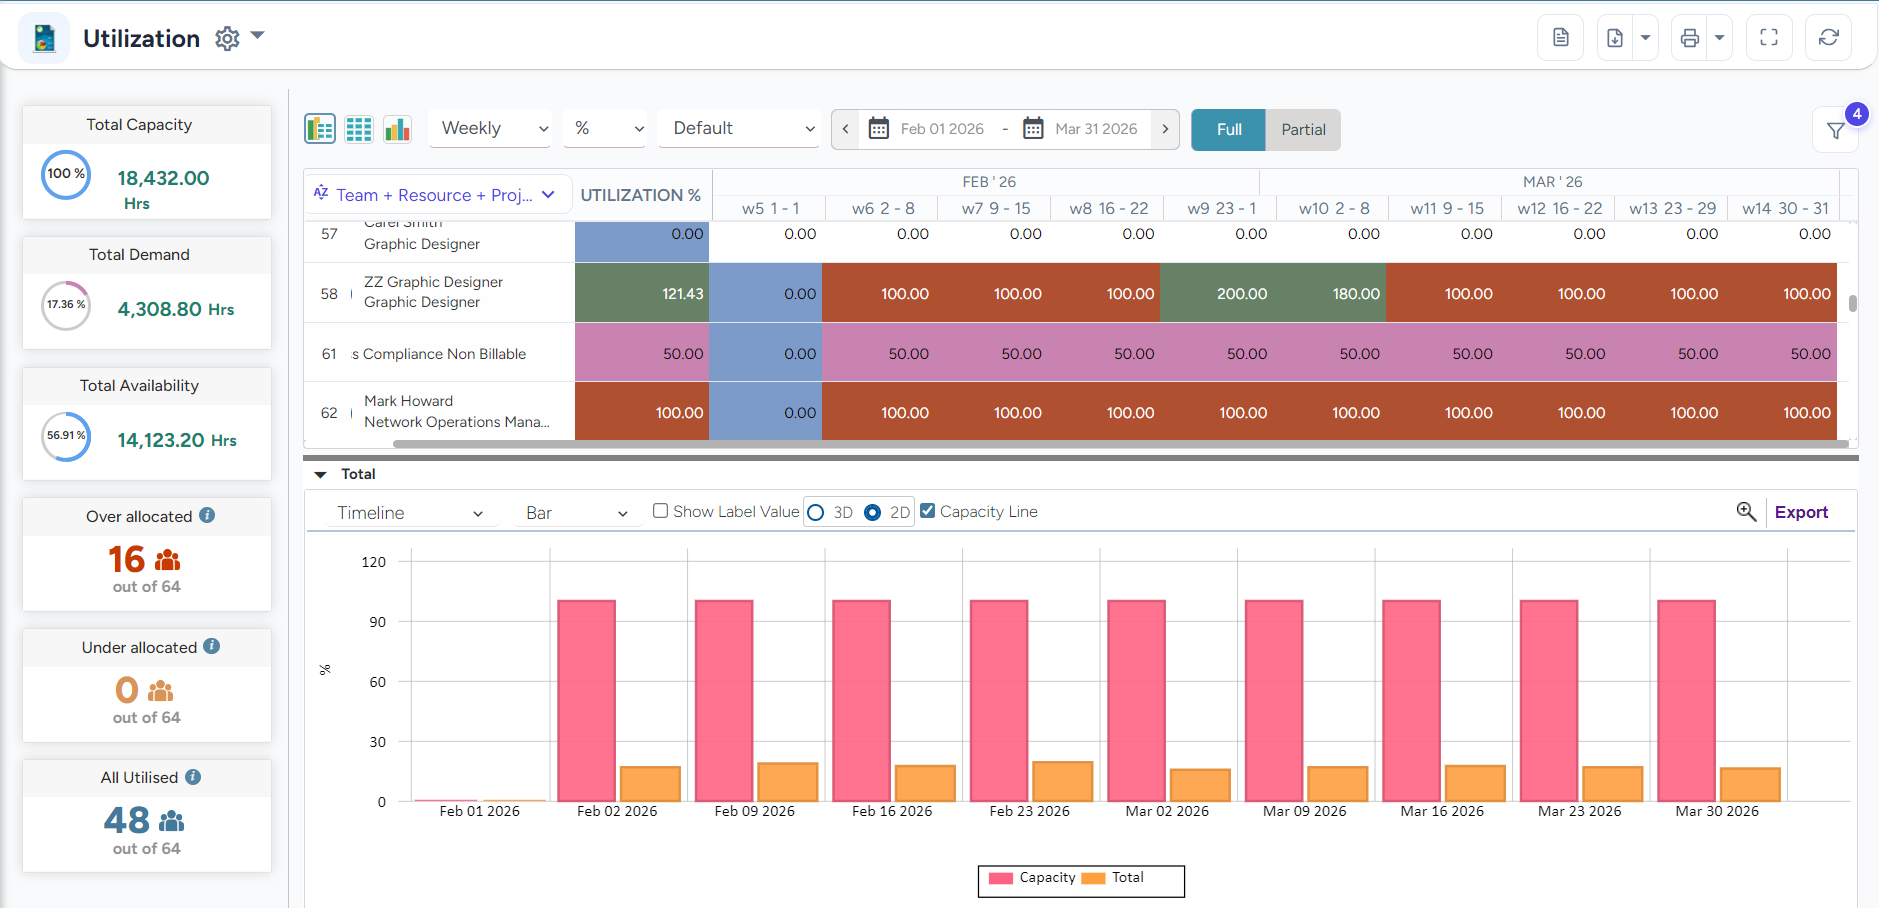 SAVIOM’s Utilization Report highlights over- or underutilization of resources using color-coded indicators, supporting faster, more informed decision-making.
Final Thoughts
Utilization reporting is no longer about tracking hours; rather, it is about enabling smarter workforce decisions. It provides the clarity managers need to balance profitability, predictability, and employee performance. Additionally, using workforce utilization reports, organizations can move from reactive firefighting to proactive planning, driving sustainable business growth.
Frequently Asked Questions (FAQs)
A utilization report is a comprehensive document that shows how effectively available resources are being used across projects and tasks. Using this data, managers can identify the instances of under- or overutilization, enabling them to balance workloads and ensure an optimized workforce.
A utilization report helps organizations improve allocation accuracy, prevent burnout and underutilization, support employee performance, enhance profitability, and enable data-driven workforce and delivery decisions.
Common types of workforce utilization reports are:
1. Billable utilization report
2. Capacity utilization report
3. Role-based utilization report
4. Project-level utilization report
5. Employee utilization report
6. Group utilization report
7. Utilization forecasting report
Critical steps for developing a workforce utilization report include:
1. Define the scope of the report
2. Identify resources to include
3. Establish the reporting time period
4. Capture available capacity
5. Assess forecasted vs. actual capacity
6. Calculate key utilization metrics
7. Analyze variances and utilization patterns
8. Review, validate, and share the report
Evaluating utilization reports usually involves:
1. Total utilization rate
2. Ideal billable utilization rate
3. Forecasted vs. actual utilization
4. Resource overutilization
5. Resource underutilization