Introduction
Billable utilization is one of the most critical metrics for organizations. It measures how much of an employee’s available time is spent on billable work that generates income for the business.
When managed effectively, billable utilization enables organizations to maximize employee productivity, sustain consistent project delivery, improve business profitability, and enhance client satisfaction.
This guide explores what billable utilization is, why it matters, and how firms can manage it strategically to strengthen financial performance while maintaining long-term team performance.
What is Billable Utilization?
Billable utilization is the percentage of an employee’s available working hours spent on client-billable tasks or projects. It measures how effectively an organization converts workforce capacity into revenue-generating work, helping track productivity, optimize staffing, and improve project profitability.
It involves distinguishing between strategic, billable, and non-billable work, such as internal initiatives, meetings, training, and administrative tasks. By monitoring this specific metric, managers can determine whether the business is generating sufficient income to cover overhead costs and sustain overall growth, and take corrective measures accordingly.
Now that we have understood what billable utilization is, let’s delve into its core benefits.
Why Billable Utilization is a Strategic Growth Lever in Services Firms?
Optimizing billable utilization in professional services boosts profit margin by turning existing capacity into revenue while keeping balanced workloads for successful project delivery.
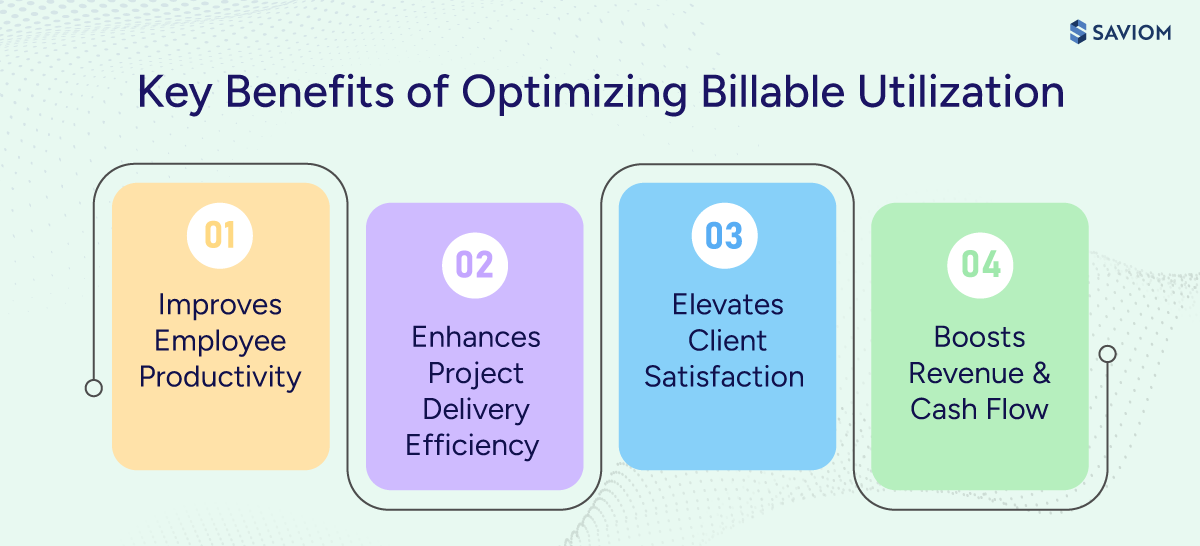
Improves Employee Productivity
When managers actively track billable and non-billable hours of consultants, it helps them gauge overall resource utilization rates accurately. This insight enables them to mobilize consultants from non-billable tasks to billable or strategic work, thereby improving employee productivity and boosting business profitability.
Enhances Project Delivery Efficiency
Effective billable utilization ensures consultants are assigned to the right projects at the right time. Balanced workloads reduce bottlenecks and prevent last-minute staffing changes. As a result, teams effectively meet project milestones, stay on schedule, and boost profit margins.
Check out our blog on project resource management.
Elevates Client Satisfaction
When billable utilization is managed effectively, consultants remain consistently engaged in active client work, yielding optimal project outcomes. Consequently, this translates to increased trust and profitability, driving long-term client relationships.
Prevents Revenue Leakage and Boosts Cash Flow
Improving billable utilization ensures more consultant time is billed to clients, reducing bench time and increasing overall revenue. Higher billable output leads to consistent invoicing and steadier cash flow, which strengthens organizational profitability.
Learn more about project ROI and ways to improve it effectively.
Having explored why billable utilization is important, let us shift our focus to the steps for calculating it.
How to Calculate Billable Utilization?
Precise calculation of billable utilization prevents revenue leakages effectively. Let us see how:
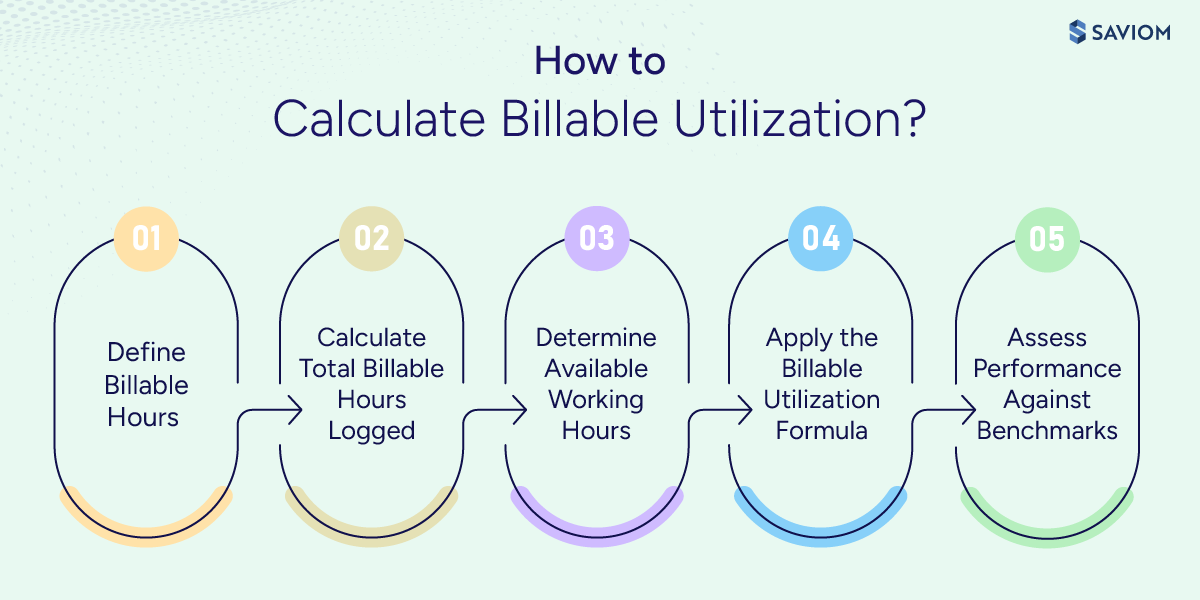
Define Billable Hours
The first step involves defining billable hours, which includes time directly chargeable to clients for consulting, implementation, or advisory services. Internal activities, such as administration, training, sales support, recruitment, and general meetings, must be excluded to ensure accurate measurement.
For example, in an IT professional services firm, hours spent by a consultant configuring a client’s ERP system or conducting project stakeholder workshops are billable. However, time spent attending internal strategy meetings or completing compliance training must be categorized as non-billable.
Calculate Total Billable Hours Logged
Next, managers must determine the total approved billable hours logged within a defined reporting period. Any unapproved, rejected, discounted, or written-off hours should be excluded because they are not recognized as billable performance for reporting purposes.
For example, if a consultant logs 160 billable hours in a month, but 20 hours are later written off due to scope overruns, only 140 approved hours should be counted. Including rejected hours would artificially inflate utilization and skew revenue projections, affecting profitability analysis.
Explore key strategies to avoid scope creep in firms.
Determine Available Working Hours
In this third step, only genuine working hours should be considered, excluding public holidays, approved leave, PTO, and non-working days. Accurate assessment of resource availability ensures utilization percentages reflect realistic capacity rather than inflated theoretical work hours assumptions.
Suppose the consultant had 160 standard monthly hours but took 16 hours of approved leave, the available working hours would be 144. Thus, billable utilization must be calculated against 144, not 160, to reflect true resource availability and maintain reporting accuracy.
Apply the Billable Utilization Formula
Once the available working hours and total billable hours are determined, the next step is to measure the billable utilization using the following formula –
Continuing with the earlier example, the consultant logged 140 approved billable hours and had 144 available working hours. Applying the formula:
Billable Utilization (%) = (140/144) x 100 = 97.2%.
Learn more about full-time equivalent (FTE) and how it improves employee productivity.
Compare Performance Results Against Benchmarks
Finally, managers must compare calculated billable utilization against predefined targets, historical trends, and industry benchmarks to determine performance gaps. This analysis helps identify issues, such as workload imbalance and excessive non-billable commitments, which can affect revenue potential and the accuracy of resource planning.
Continuing the example, if the firm’s target utilization is 85%, the consultant’s 97.2% rate exceeds expectations. While strong financially, sustained resource overutilization may indicate burnout risk or insufficient buffer capacity. This enables the leadership to proactively redistribute workloads to maintain sustainability.
In the next section, let us understand common billable utilization benchmarks.
What is a Good Billable Utilization Rate? (Benchmarks by Industry & Role)
Setting the right utilization benchmark drives organizational profitability without overloading your team. So, what does a “good” utilization rate actually look like? Let’s break down industry benchmarks and role-based ranges.
Benchmarks by Industry
There is no single universal “good” rate, but most firms operate within 60%–85% billable utilization. These targets can vary based on delivery model, governance load, and the structural responsibilities of key roles within each industry.
- IT & Digital Services: Typically operate in the 70%–85% range, with delivery teams on the higher end and solutioning or support functions on the lower end due to presales, reviews, and governance work.
- Professional Services & Consulting: Core delivery roles commonly target 70%–80%, balancing billable client work with advisory responsibilities, business development, and internal knowledge initiatives.
- Audit & Accounting: Firms generally operate within the 70%–85% range for delivery staff, with seasonal peaks during audit and tax cycles driving higher short-term utilization.
- AEC (Architecture, Engineering, Construction): Often run between 70%–85%, depending on project intensity, design phases, and regulatory or coordination overhead.
- Healthcare Services (clinical, IT, and support services): Utilization varies widely but generally falls in the 60%–80% range due to compliance, documentation, and non-billable care or support activities.
Benchmarks by Role
- Software Engineers (80%–85%): Software engineers typically maintain high utilization because they focus primarily on implementation, configuration, and build activities that directly generate revenue.
- Solution Architects (65%–75%): Solution architects divide their time between presales consulting, technical design validation, and delivery oversight, which reduces their fully billable capacity despite their strategic importance.
- Junior Consultants (80%–85%): Junior consultants are largely execution-focused and have limited business development or governance responsibilities, enabling them to sustain higher billable deployment rates.
- Senior Consultants (65%–75%): Senior consultants balance client delivery with mentoring, advisory input, and internal capability development, which moderates achievable billable levels.
- Engagement Managers (55%–65%): They oversee project health, client relationships, and commercial governance, meaning a portion of their effort remains strategically necessary but not directly billable.
- Audit / Tax Associates (75%–85%): Associates typically maintain high chargeable hour targets, particularly during peak audit and tax seasons, as their responsibilities are primarily delivery-driven.
- Audit / Tax Managers (65%–75%): Managers balance direct delivery with review responsibilities, client advisory work, and team supervision, which lowers sustained billable capacity.
- Partners / Principals (40%–60%): Partners focus primarily on business development, client strategy, and firm leadership rather than day-to-day delivery, resulting in lower billable targets.
- Design Engineers (75%–85%): Design engineers spend most of their time on project execution and technical production, enabling higher billable utilization during active phases.
- Construction Project Managers (60%–70%): Project managers dedicate significant time to coordination, compliance, and vendor management, which limits fully revenue-chargeable allocation.
- Healthcare Consultants / Specialists (65%–75%): Healthcare consultants balance implementation or advisory work with regulatory documentation and compliance requirements, moderating total billable allocation.
- Healthcare Program Managers (55%–65%): Program managers handle administrative oversight, reporting, and governance responsibilities that reduce direct billable capacity.
Check out our blog on ways to improve billable utilization in professional services firms.
Now that we have learned about the ideal billable utilization rate for firms, let us move on to understanding the differences among key utilization concepts.
Billable Utilization vs. Resource Utilization vs. Capacity Utilization
Understanding the distinction among these three concepts is essential for resource management, as each addresses a different strategic question: monetization, productivity, and capacity alignment. Let us see the difference in detail:
| Aspect | Resource Utilization | Billable Utilization | Capacity Utilization |
|---|---|---|---|
| Definition | Percentage of available time spent on all productive work (billable + non-billable) | Percentage of available time spent on client-chargeable (revenue-generating) work | Percentage of total potential capacity (max output) actually used for work |
| Core Question Answered | Are our people being effectively used? | Are we monetizing our people’s time? | Do we have enough (or excess) capacity? |
| Focus | Overall workforce productivity & efficiency | Profitability & revenue directly from clients | Maximum throughput vs. demand alignment |
| Optimal Target | 80-90% (sustainable productivity) | 70-85% (industry benchmark) | 85-95% (avoids over/under-capacity) |
| Primary Use Case | Workload balancing, burnout prevention | Pricing, invoicing, and margin growth in services firms | Demand forecasting, scalability planning |
| Primary Users | Delivery managers, PMOs | Finance, leadership, and services heads | PMOs, resource planners, and leadership |
| Key Risk if Low | Benched resources, poor ROI on payroll | Revenue leakage, unprofitable projects | Underutilized potential, growth bottlenecks |
Having established the difference, let us explore its impact on business profits.
How Billable Utilization Impacts Revenue, Margin & Profitability?
Billable utilization determines how effectively your workforce costs translate into revenue, gross margin, and overall profitability.
Impact of Billable Utilization on Revenue Generation
Billable utilization affects revenue by increasing the share of available consultant time that is billed to clients. When more paid hours are charged to client work, revenue goes up. Higher utilization also increases revenue per employee because a larger portion of payroll time generates income.
Read this eBook to learn how a 5th gen resource management helps firms optimize resource utilization and boost revenue & project profitability.

Impact of Billable Utilization on Gross Margin
Gross margin measures the revenue left after covering direct delivery costs, primarily salaries. Higher utilization improves gross margin because payroll costs are supported by more billable hours. As a larger share of paid time is billed to clients, revenue improves while salary expense remains relatively fixed, increasing the gross margin percentage.
Check out our blog on resource cost reduction strategies to boost profitability.
Impact of Billable Utilization on Overall Profitability
When consultants maintain consistent, sustainable utilization levels, firms generate stable revenue without increasing operating costs at the same rate, directly improving overall profitability. Stronger profitability enhances cash flow and gives the firm greater capacity to reinvest in talent, technology, and growth initiatives.
In the following section, let us understand the reasons why analyzing forecast vs. actual billable utilization variance is essential.
Why Analyzing Forecast vs. Actual Billable Utilization Variance Matters?
Forecasted utilization sets financial expectations, but actual utilization reveals operational reality, making the gap between the two a powerful indicator of planning accuracy and execution discipline.
- Improves revenue predictability: Variance analysis shows whether projected billable hours are translating into actual revenue, helping leadership identify gaps before they affect monthly or quarterly financial targets.
- Strengthens delivery planning accuracy: Persistent gaps between forecasted and actual utilization reveal weaknesses in capacity forecasting, demand planning, or resource allocation practices, which can impact delivery outcomes.
- Helps identify burnout or bench risk early: Higher-than-forecast utilization may signal overload and burnout risk, while lower-than-forecast utilization indicates capacity wastage and lost revenue opportunities.
- Protects cash flow stability: Monitoring forecast vs. actual utilization variance helps detect revenue gaps early. By correcting underperformance before billing cycles are affected, firms can maintain steady invoicing and protect cash flow.
Learn more about workforce capacity planning and how it enables structured resourcing decisions.
Having understood the importance of tracking forecast vs. actual billable utilization, let’s explore the reasons for it becoming low.
Common Causes of Low Billable Utilization
Here are the common reasons why billable utilization is constantly low in some organizations:
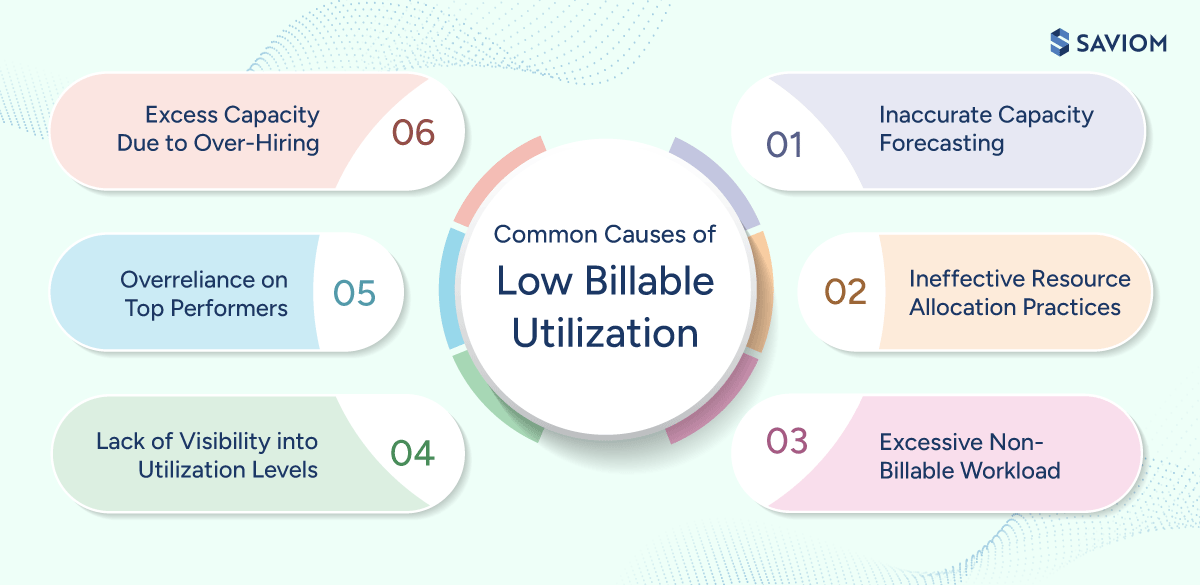
Inaccurate Capacity Forecasting
Lack of visibility into future pipelines and confirmed project demand often leads to poor resource capacity planning. When staffing decisions are made reactively, managers fail to accurately align available skills with project requirements, thereby reducing productivity.
Ineffective Resource Allocation Practices
Assigning consultants based solely on availability rather than skills, expertise, or role fit undermines effective utilization and project quality. It often leads to high-value resources handling low-complexity or non-billable tasks, reducing revenue contribution and strategic impact.
Learn why overallocation of resources is bad for your firm.
Excessive Non-Billable Workload
High administrative overhead and internal workload often consume a disproportionate share of consultant time, pushing aside revenue-generating billable work. Without clear governance, non-billable activities, such as internal meetings, reporting, cross-functional initiatives, etc., gradually increase, limiting utilization.
Lack of Visibility into Utilization Levels
When managers track resource utilization retrospectively, they lack early warning indicators that help identify emerging issues such as workload imbalance, resource underutilization, prolonged bench time, etc. Consequently, this increases employee burnout and disengagement and reduces overall productivity.
Overreliance on Top Performers
As per a McKinsey report 2023, “high performing employees can be 800 times more productive than average employees, illustrating the magnitude of reliance on top performers.”
Managers often schedule the same senior or trusted consultants for high-priority initiatives, assuming they are the safest choice for complex work. Meanwhile, other capable billable staff remain underutilized due to risk aversion or habit-based staffing decisions, resulting in uneven utilization across teams and increased bench time.
Explore our blog on resource scheduling and its importance for successful project delivery.
Excess Capacity Due to Over-Hiring
Hiring ahead of confirmed demand often leads to inflated bench strength, increasing payroll costs without immediate revenue support. When this buffer capacity is not actively monitored, redeployed, or aligned with pipeline visibility, it leads to resource underutilization and compromised profit margins.
In the following section, let’s see how to tackle these billable utilization challenges effectively.
Proven Strategies to Improve Billable Utilization Without Burnout
Improving billable utilization demands structured, sustainable strategies that increase revenues while protecting employee well-being and long-term delivery quality. Here are some billable utilization strategies that help achieve the same:
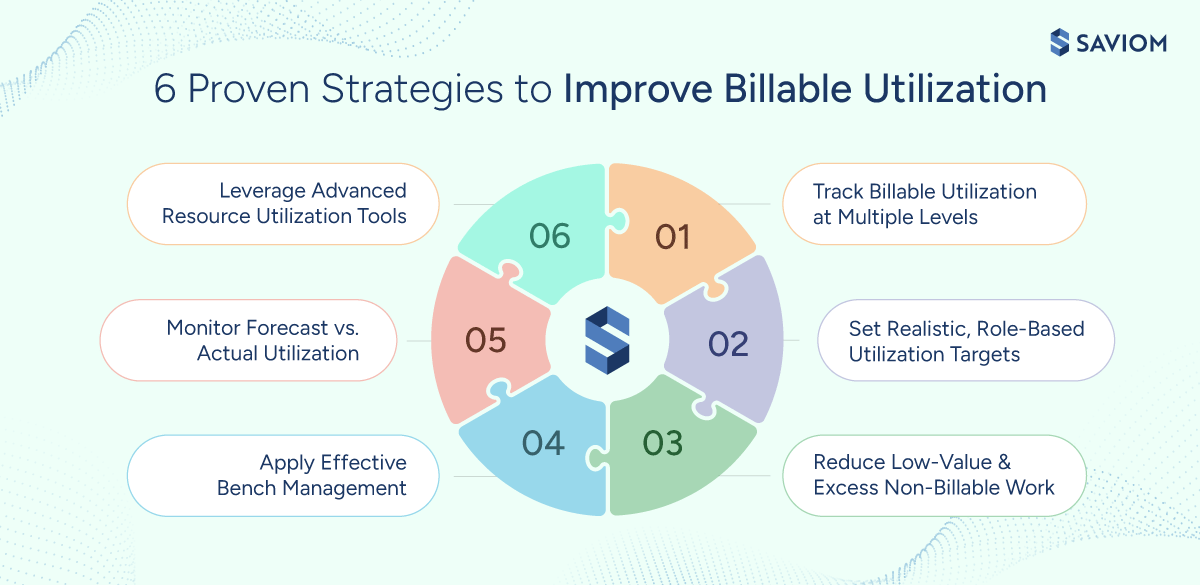
Track Billable Utilization at Multiple Levels
Managers must regularly track billable utilization trends across departments, roles, individual resources, and locations. This helps them understand systemic patterns of over- and underutilization and take timely corrective actions to optimize workload distribution and boost productivity.
Set Realistic, Role-Based Utilization Targets
Define utilization targets by role rather than applying a single benchmark across the business. Delivery-focused roles, such as junior consultants or analysts, can sustain higher utilization levels. At the same time, senior professionals should have lower targets to account for mentoring, governance, and other non-billable commitments.
Learn key steps to optimize resource utilization in firms.
Reduce Low-Value and Excess Non-Billable Work
Organizations must first identify internal activities like excessive meetings, redundant reporting, administrative overhead, etc., that consume consultant time without contributing meaningful business value. Evaluate these activities regularly and eliminate, automate, or streamline them where possible.
Apply Effective Bench Management
Managers must actively manage and minimize bench time by aligning available consultants with upcoming pipeline demand. When immediate project work is unavailable, implement targeted upskilling, retraining, and cross-training initiatives to prepare benched consultants for upcoming or anticipated demand.
Read more on how retraining and upskilling can future-proof your workforce.
Use Forecast vs. Actual Utilization to Course-Correct Early
Compare forecasted and actual utilization to identify utilization gaps early and make timely adjustments. This helps keep utilization forecasts aligned with actual performance, improving project planning accuracy and strengthening the reliability of revenue and profitability projections.
Leverage Advanced Resource Utilization Tools
Implement real-time resource utilization tools to continuously track how consultant time is allocated across projects. These tools help managers quickly identify over- and underutilized resources and take proactive measures to ensure balanced employee workloads and higher business productivity.
Check out our blog on utilization report and how to create it.
Now, let us understand key performance indicators that help track billable utilization in firms.
Critical Billable Utilization KPIs & Metrics
Tracking the right billable utilization KPIs and metrics ensures that leadership decisions are grounded in measurable performance indicators rather than assumptions. So, given below are common ones:
Billable vs. Non-Billable Hours
Billable vs. non-billable hours track how much time an employee dedicates to revenue-generating client work compared to internal activities, such as BAU tasks, meetings, training, etc., that cannot be invoiced. This KPI helps assess how effectively available capacity is being utilized, thereby improving billability.
The formula to calculate billable vs. non-billable hours is as follows –
Learn key resource management metrics that firms should track.
Capacity Utilization Rate
The capacity utilization rate is the percentage of an organization’s total available capacity that is actively engaged in productive work during a specific period. This transparency helps managers detect patterns of over- or underutilization and implement measures to improve resource allocation decisions and enable optimal utilization.
Forecast vs. Actual Utilization
This metric measures the gap between estimated resource utilization and the time actually spent on billable or productive work. By monitoring this metric regularly, managers gain early visibility into emerging imbalances, identify resource planning bottlenecks, and make timely adjustments to bridge the gap.
Understand how firms can perform accurate resource forecasting for timely project initiation.
Revenue Per Consultant
It measures the amount of revenue each resource generates within a specific period, providing a clear view of individual contribution to the firm’s financial performance. This metric helps assess overall team profitability by linking workforce output directly to revenue outcomes.
Bench Utilization Rate
This measures the percentage of benched employees who are successfully redeployed to billable projects within a given period. Monitoring this metric helps managers correct workload imbalances, reduce overhead costs, and improve overall employee productivity.
Check out our blog on ways to track employee productivity.
Realization Rate
Realization rate measures the proportion of planned or potential billable work that is successfully converted into billed revenue. It provides visibility into whether recorded billable hours are fully invoiced or reduced due to write-offs, discounts, or scope misalignment. By monitoring this metric, organizations can improve scope control, protect margin integrity, and boost ROI.
Gain real-time visibility into resource utilization trends and maintain an optimal resource health index using SAVIOM’s advanced resource management software. Get your free demo now.

Finally, let us understand how robust resource management software helps track and boost billable utilization in firms.
How Does SAVIOM Help Boost Billable Utilization in Firms?
SAVIOM’s 5th gen resource management software offers advanced capabilities that help firms enhance billable utilization.
- The all-in-one resource planner consolidates and provides real-time, unified insight into utilization data across multiple levels, such as departments, roles, and individual resources.
- The embedded resource heatmaps flag over- or underutilization of consultants using color-coded views, which enable managers to take timely corrective measures.
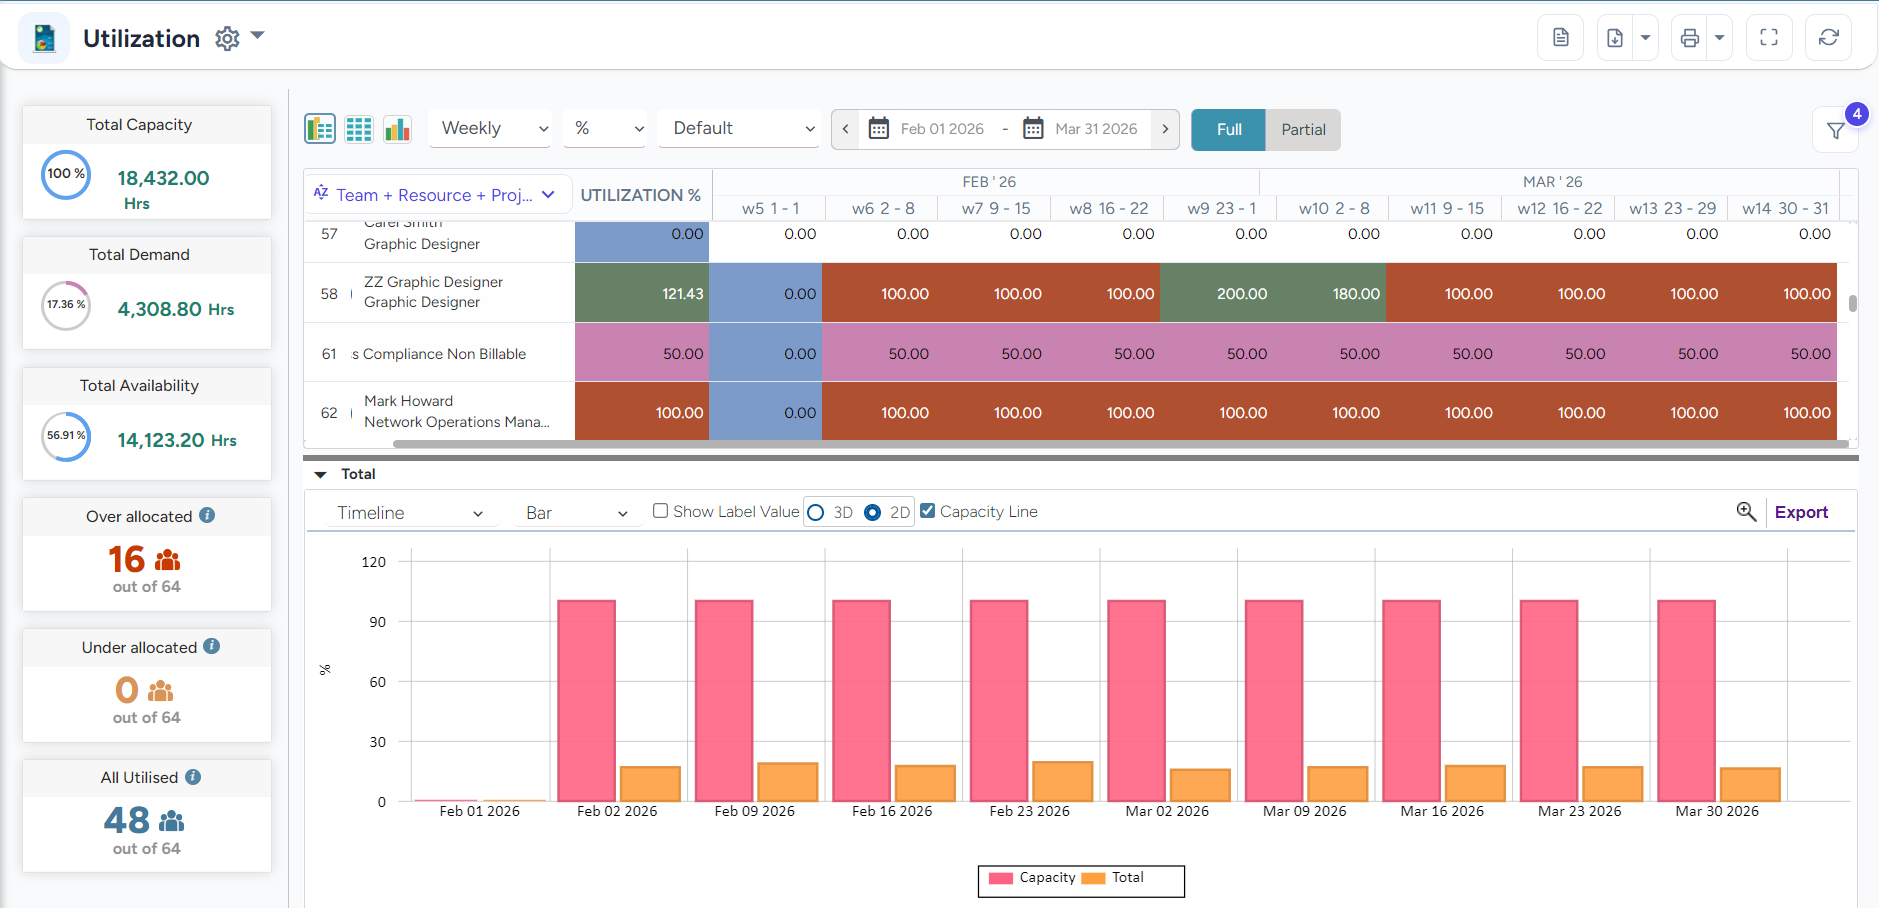 SAVIOM’s Utilization Report visualizes resource over- or underutilization using color-coded indicators, supporting data-driven decision-making.
- The KPI forecaster provides real-time insights into critical resource metrics, including availability, utilization, burnout, and bench time.
- The real-time BI reports and dashboards provide insights into forecast vs. actual performance, project vacancy, and people-on-the-bench to support informed decision-making.
- Finally, the what-if analysis helps simulate multiple allocation plans to arrive at an optimized resource plan.
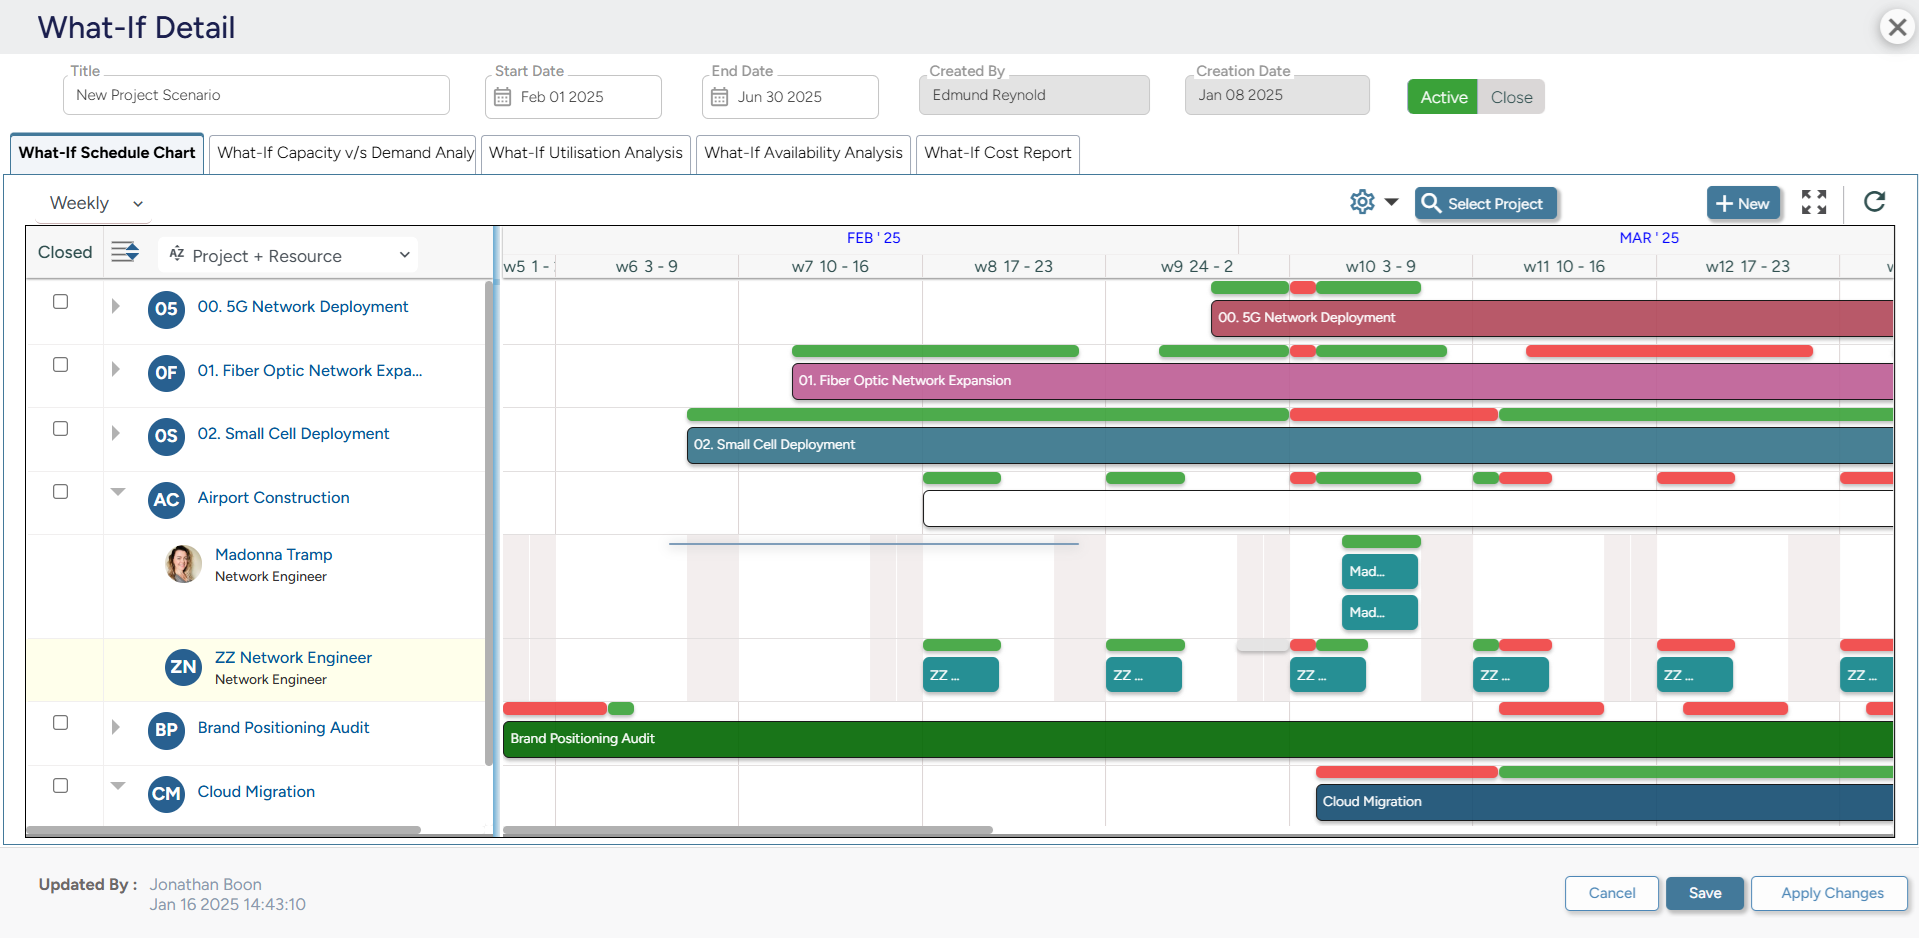 SAVIOM’s What-If Analysis enables firms to simulate and compare multiple resource scenarios to come up with the most profitable outcome.
Conclusion
Billable utilization is not just a performance metric; it is a direct driver of revenue strength, margin stability, and long-term profitability in professional services. When managed strategically, it transforms existing capacity into predictable financial outcomes without increasing headcount.
Frequently Asked Questions (FAQs)
Billable utilization is the percentage of an employee’s available working hours spent on client-billable tasks or projects. It measures how effectively an organization converts workforce capacity into revenue-generating work, helping track productivity, optimize staffing, and improve project profitability.
Billable utilization is important for firms because it:
1. Improves employee productivity
2. Enhances project delivery efficiency
3. Improves client satisfaction
4. Prevents revenue leakage and boosts cash flow
For client-facing delivery roles in consulting, IT services, and professional services, a healthy target is usually 75–85%. Senior specialists and architects often operate effectively at 65–75%, as their role includes solution design, mentoring, and oversight. Managers and practice leads generally have lower targets of 50–65% due to leadership, planning, and governance responsibilities.
The common causes for low billable utilization are as follows:
1. Inaccurate capacity forecasting
2. Ineffective resource allocation practices
3. Excessive non-billable workload
4. Lack of visibility into utilization levels
5. Overreliance on top performers
6. Excess capacity due to over-hiring
A few critical strategies to maximize billable utilization are:
1. Track billable utilization at multiple levels
2. Set realistic, role-based utilization targets
3. Reduce low-value and excess non-billable work
4. Apply effective bench management
5. Use forecast vs. actual utilization to course-correct early
6. Leverage advanced resource utilization tools