Make Fast Decisions with Real-time Business Intelligence
Meet changing resource demands for projects with real-time business intelligence reports, analytics, and dashboards. Make informed decisions and improve the resource health index.

Trusted by Many Fortune 500 Companies Across 50+ Countries. Over 20 Years in Business.
THE ULTIMATE BI POWER
Get Real-Time Business Intelligence for Fast Changing Business Dynamics
Use real-time business intelligence reports and analytics to make fast decisions and meet dynamically changing project resource demands. Get a granular view of data and apply suitable filters to give stakeholders the data they need to make informed and strategic decisions.
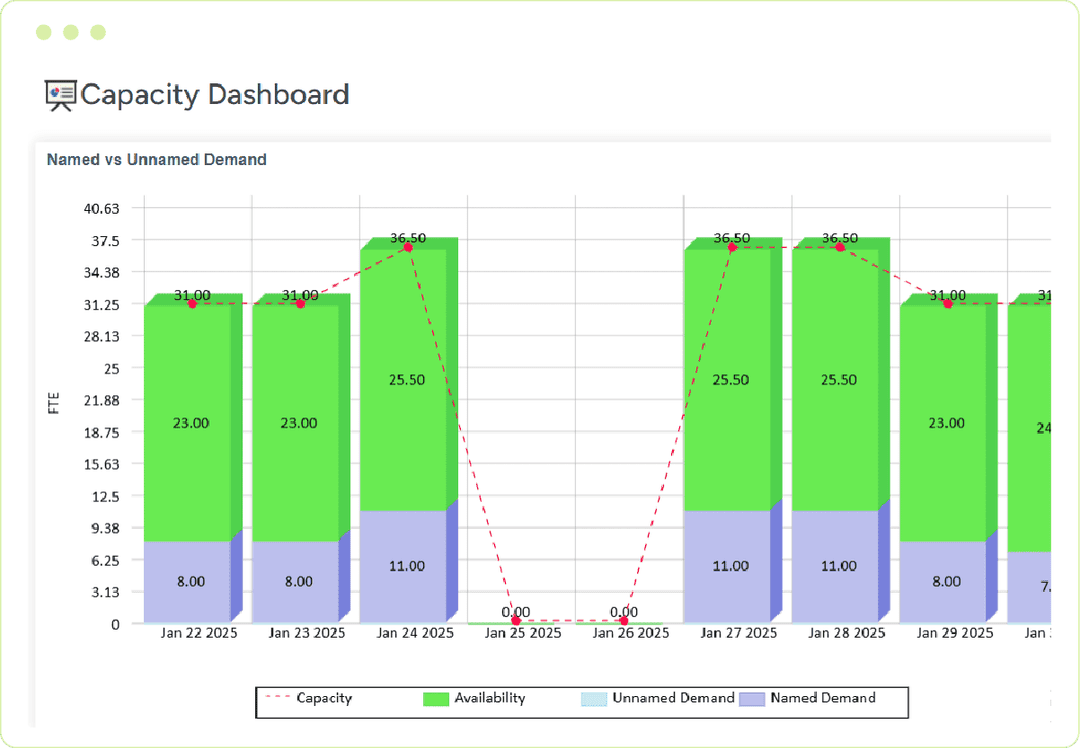
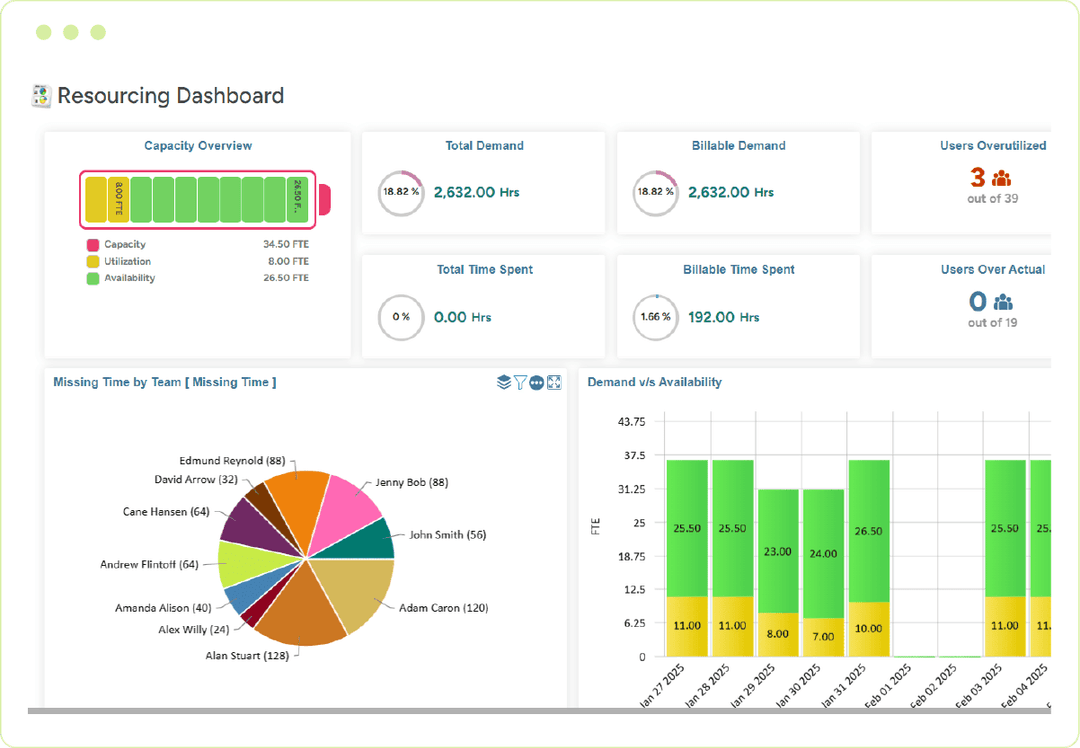
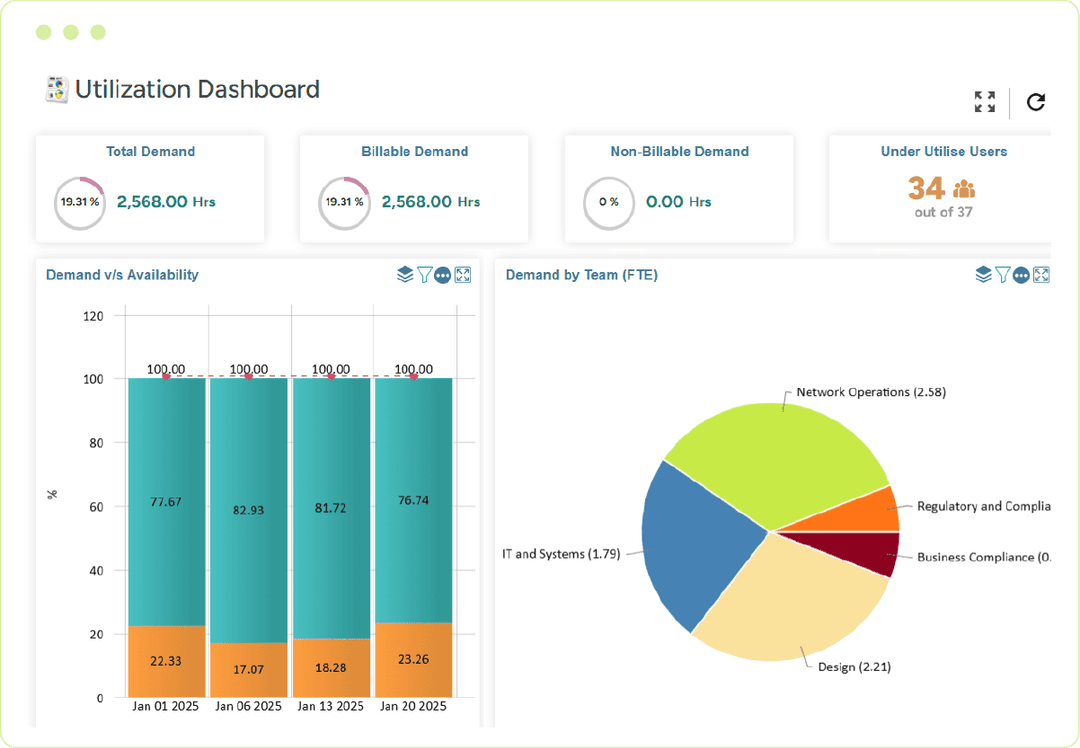
Design Dynamic Dashboards
Build Custom Dashboards that Work for Different Stakeholders
Customize views, dashboards, and reporting analytics to simplify and fast-track decisionmaking. Create a personalized dashboard view with deep graphical analytical capabilities using SAVIOM highly configurable component-based architecture. Provide role-specific dashboards to multiple stakeholders across a matrix organizational structure.
Use Forecasting Analytics
Forecast Resource Demands Across Enterprise and Plan for Tomorrow
Use our advanced analytics to forecast short/long-term resource demands across departments, teams, locations, offices, business units, etc., and overcome resource planning bottlenecks. Forecast vs. actual report helps you improve the overall accuracy of work estimation.

Custom Reports
Cut Through the Clutter of Information Overload for Precise Custom Reports
Role-based access helps avoid information overload and lets you see relevant information for quick decision-making. SAVIOM's configurable resource reporting framework gives you the flexibility to select your sorting dimensions, filters, and formulas.


Book a Free Demo
See how intuitive and powerful our Resource Management Software is by booking a free, customized demo

Rapidly Advance Your Resource Management Maturity
SAVIOM is the world leader in resource management. Our solution has helped many Fortune 500 companies to achieve their optimal resource management maturity level and improve workforce productivity along with operational efficiency.

Boost Productive Utilization by 10-20%

Reduce Project Resource Cost by 10-30%

Boost Team's Efficiency and Productivity

Deliver Projects on Time

We're for Everyone Our Software Caters to All Industries

Accounting, Audit, and Law
Boost the billable utilization of every accountant for profitability

Architecture & Engineering
Optimize the AEC workforce and deliver projects successfully

Information Technology
Manage IT workforce efficiently & boost productivity

Professional Services
Bridge skill gaps of consultants and beat market volatility
Integrate Seamlessly with Your Existing Systems
- 01
Control your sync frequency
Real-time or batch integration with any data source, including ERP, ERM, Project planning tools, PPM tools, and HR. - 02
Multiple data points
Choose the type of data to exchange (staff, projects, tasks, timesheet, leave, etc.). - 03
Only sync what you need
Interface with existing business intelligence and reporting systems. - 04
Extensive reporting
Set up workflow alerts to streamline the workforce planning process.


The Ultimate Guide to an Efficient Resource Management
Why Customers Love Us?
Our Insightful eBooks


Explore More of Other SAVIOM Products


Book a 60-Day Free Trial
See how intuitive our solution is by booking a free trial, customized as per your business needs