Introduction
Managing projects without tracking resource performance is like driving without a dashboard. Progress may continue, but capacity constraints, skill shortages, and uneven workload distribution remain hidden. The result? Delayed delivery, resource burnout, and constant firefighting.
That’s where resource management metrics make a difference. They give you real-time insight into resource capacity, utilization, and performance, enabling leaders to spot risks, rebalance workloads proactively, and make informed decisions before issues escalate.
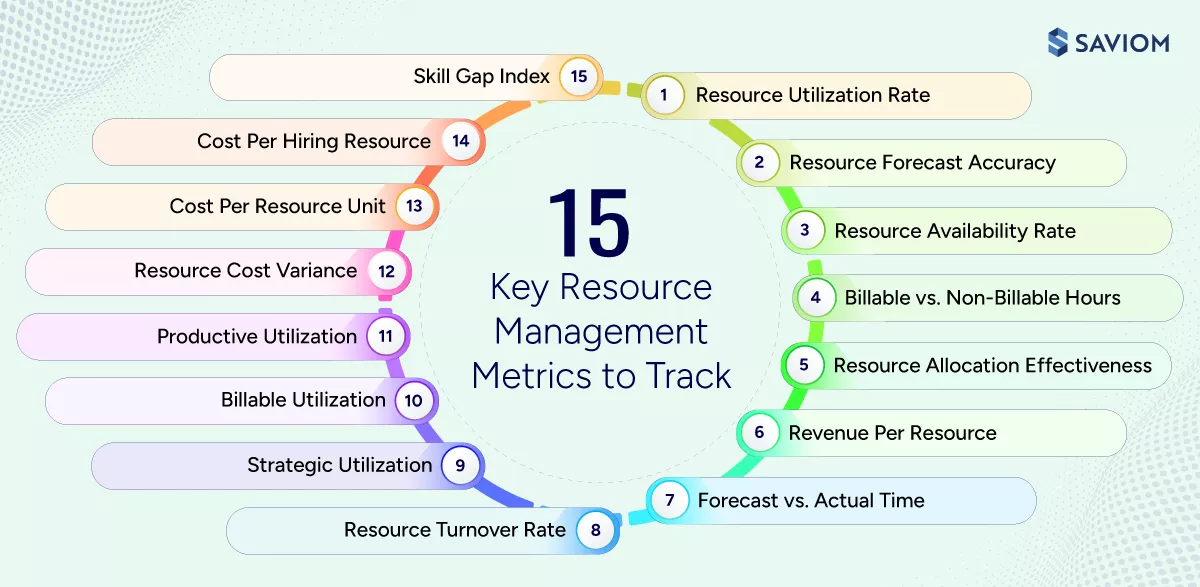
In this article, we outline 15 critical resource management metrics that bring clarity to resource planning and execution.
What are Resource Management Metrics?
Resource management metrics are quantifiable measures used to evaluate how effectively an organization plans, allocates, and utilizes its workforce based on their skills, availability, and costs across projects.
In practice, these metrics help firms improve resource forecast accuracy, minimize over- and underutilization, prevent cost overruns, and enable timely project delivery. This ultimately strengthens operational efficiency, improves profit margins, and drives sustainable business growth.
Having understood the definition, the following section explores the criticality of evaluating resource management KPIs for business success.
Why is Monitoring Resource Management Metrics Important?
Tracking resource metrics unlocks a range of benefits. Here are a few compelling reasons why organizations should be monitoring critical KPIs:
Enables Proactive Capacity and Demand Forecasting
Tracking capacity, utilization, and demand metrics supports accurate resource forecasting. This enables managers to identify upcoming gaps or surpluses early and plan hiring, upskilling, or reallocation in advance. Consequently, it prevents last-minute firefighting and ensures projects are staffed accurately as demand evolves.
Ensures Balanced Workload Distribution
Utilization and allocation metrics reveal who is overloaded, underutilized, or misaligned to work. This allows managers to redistribute tasks evenly across teams, preventing employee burnout while minimizing bench time. Balanced workloads improve productivity, engagement, and consistency in project delivery.
Learn more about workload distribution and how to balance work effectively across teams.
Supports Faster Data-Driven Decisions
Real-time visibility into availability, utilization, and performance enables quicker and more confident decision-making. Managers can reassign resources, reprioritize work, or approve new initiatives based on data, not assumptions. This reduces delays and keeps execution aligned with business priorities.
Enable faster, more confident decisions with SAVIOM’s 5th gen resource management software. Book a demo to see how it works.

Enables Early Risk Detection and Proactive Mitigation
Metrics such as overallocation, schedule variance, and capacity utilization act as early warning signals for resource risk. Teams can intervene before issues escalate by adjusting workloads, timelines, or resourcing plans. This proactive approach prevents disruptions and protects project outcomes.
Explore further on enterprise risk management and steps to implement it.
Improves Project Profitability and Cost Control
Cost per resource unit, billable utilization, and revenue-per-resource metrics provide clear visibility into financial efficiency. Organizations can identify inefficiencies and cost overruns early and take corrective action. Continuous monitoring helps protect margins while maximizing the return on every resource invested.
Now that the importance is clear, let’s jump into understanding the essential metrics for effective resource management that offer the most actionable insights.
Critical Resource Management Metrics You Should Track
The following are the top resource management KPIs every manager should monitor to enhance employee performance, keep projects on schedule, and drive overall business profitability:
Resource Utilization Rate
The resource utilization rate is one of the critical metrics that measures the percentage of a resource’s available time spent on productive, value-adding tasks. It helps organizations evaluate how effectively resources are utilized relative to their total capacity, ultimately facilitating workload balancing and preventing over- or under-allocation.
The formula to calculate the resource utilization rate is:
X 100
Read our step-by-step guide on how to track resource utilization.
Resource Forecast Accuracy
Resource forecast accuracy refers to the degree to which an organization’s predicted resource demand aligns with the actual resources required. It serves as a key indicator of the reliability of the resource planning process, enabling managers to assess performance and identify areas that need course correction.
The formula to calculate resource forecast accuracy:
Demand) X 100
Resource Availability Rate
Resource availability rate is the percentage of time a resource (human or non-human) is available to perform productive work within a specific timeframe. It quantifies the portion of a resource’s total capacity that can be assigned to tasks, accounting for current commitments, scheduled leave, maintenance, and other organizational constraints.
The formula to calculate the resource availability rate:
Billable vs. Non-Billable Hours
Billable vs. non-billable hours is another critical KPI that shows how effectively an organization utilizes its workforce time between revenue-generating work and non-billable activities. Billable hours represent client-facing tasks that directly generate revenue. In contrast, non-billable hours include activities such as training, internal meetings, or administrative work that cannot be charged to the client.
The formula to calculate billable vs. non-billable hours is:
Read our blog on the key differences between billable and non-billable work.
Resource Allocation Effectiveness
This resource metric calculates how appropriately an organization assigns its available resources, such as people, equipment, and finances, to tasks and projects to achieve optimal results with minimal waste. It indicates whether resources are deployed to the most suitable activities at the right time and the right cost.
The formula to calculate resource allocation effectiveness is:
Allocated Hours) X 100
Better resource allocation drives lower project costs. Read our eBook to see how enterprises achieve 10–30% savings with 5th gen resource management.

Revenue Per Resource
This is one of the vital KPIs that measures the revenue generated by each resource over a specific timeframe. It provides valuable insight into how effectively the organization leverages its workforce to achieve business objectives and drive project profitability.
The formula to calculate revenue per resource is:
Resources
Forecast vs. Actual Time
Forecast vs. actual time compares the estimated hours a resource is expected to spend on assigned work with the actual hours recorded. This resource metric enables managers to identify variances and take corrective actions to bridge the gap. Thus, it helps improve demand forecasting and avoid under- or overallocation of resources.
The formula to calculate forecast vs. actual time is:
X 100
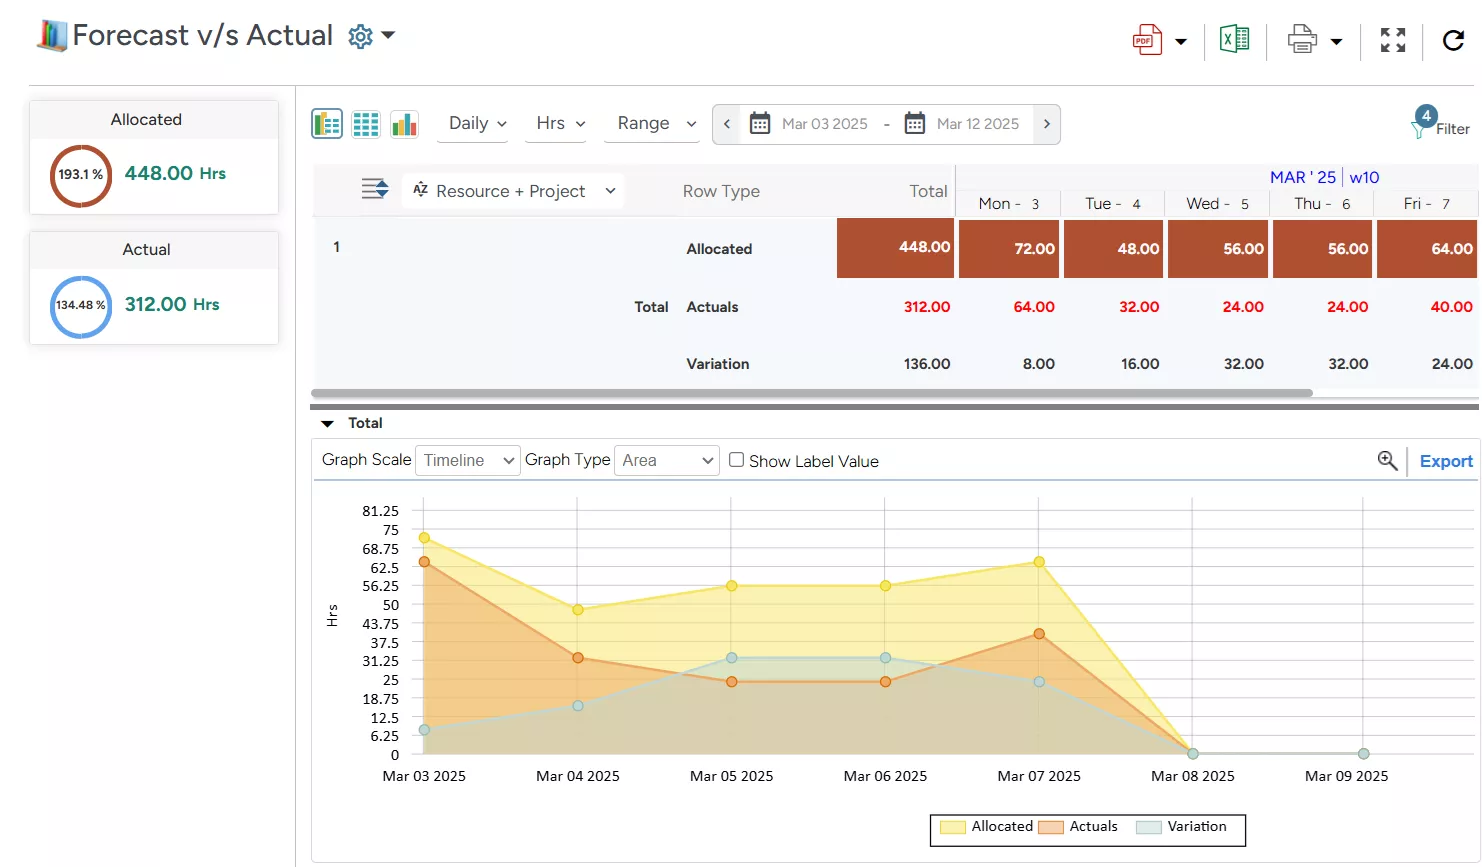 SAVIOM’s Forecast vs. Actual Report highlights estimated vs. actual time spent on tasks, helping managers identify variances and take corrective action.
Resource Turnover Rate
The resource turnover rate measures the frequency at which employees or other resources leave an organization and are replaced within a specified period. Monitoring this metric enables firms to proactively identify employee retention challenges, enhance resource planning, and maintain team consistency.
The formula to calculate resource turnover rate is:
Average Number of Resources During Period) X 100
Discover the top 11 employee retention KPIs businesses should track.
Strategic Utilization
It’s a key KPI that measures the proportion of a resource’s time dedicated to long-term strategic initiatives aligned with the organization’s strategic projects. This metric helps firms gain clarity on how effectively their existing talent is being utilized toward projects that drive innovation or market expansion.
The formula to calculate strategic utilization is:
X 100
Billable Utilization
Billable utilization is another vital KPI that measures the percentage of an employee’s total available hours dedicated to billable, client-focused tasks. This metric highlights how effectively resources contribute to revenue generation. Moreover, in the event of discrepancies, firms can promptly intervene to optimize resource utilization and secure healthy profit margins.
The formula to calculate billable utilization is:
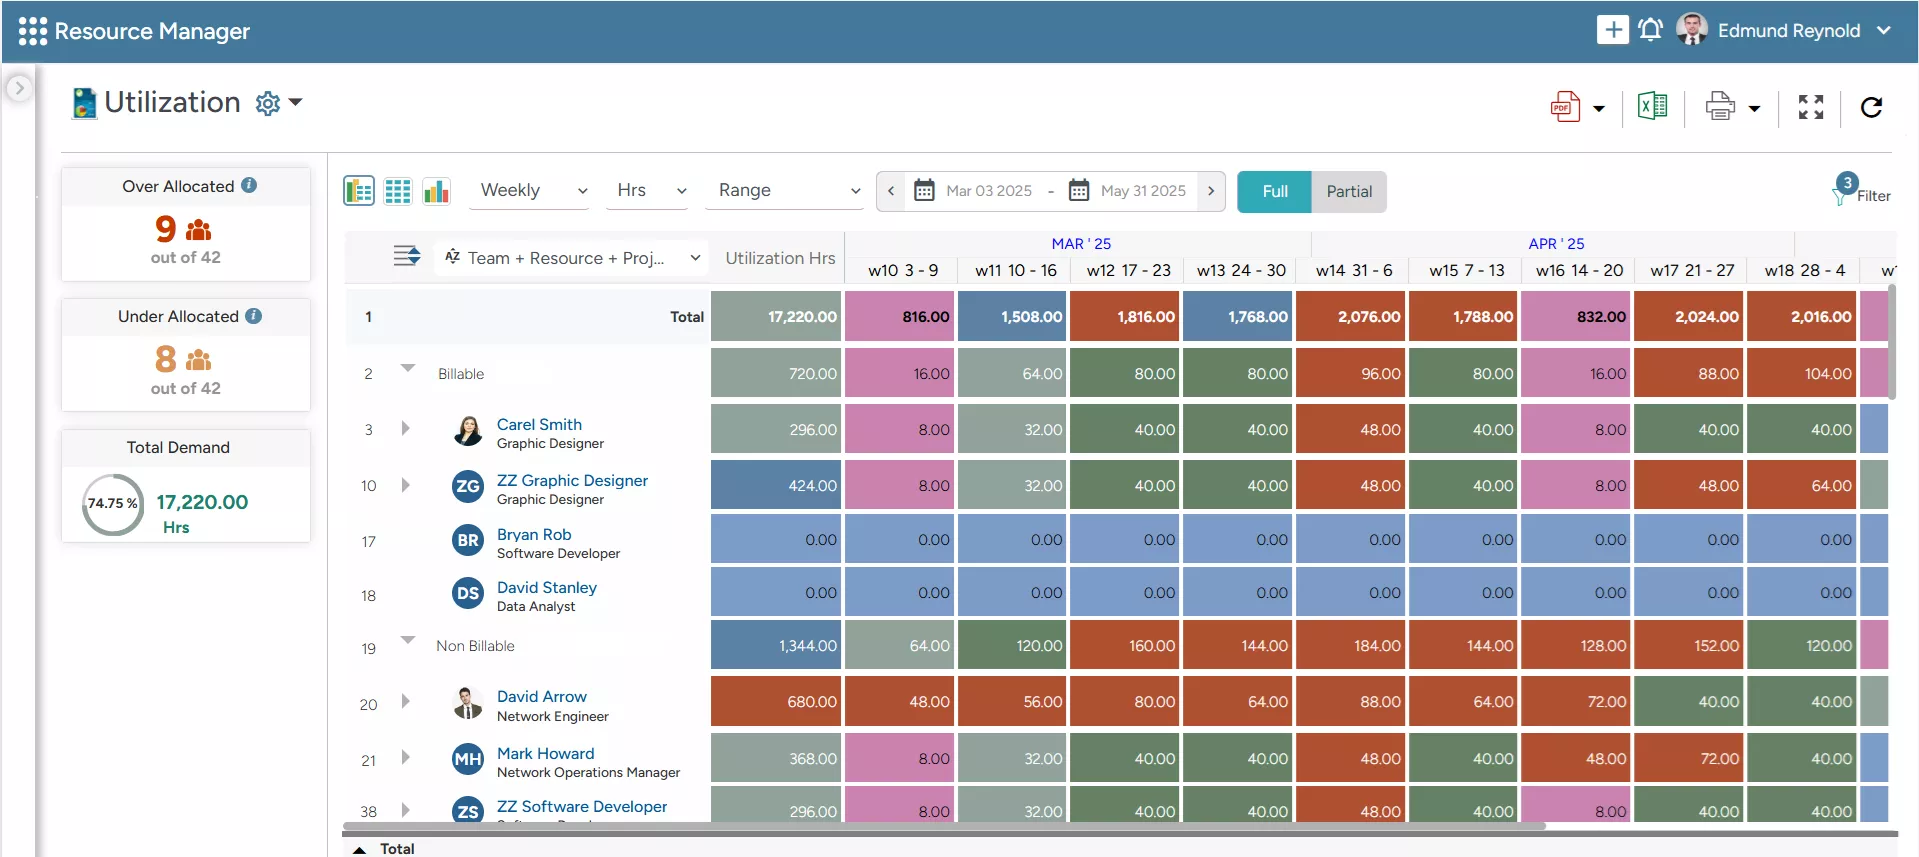 SAVIOM’s Color-Coded Heatmap highlights the utilization levels of every resource, enabling managers to identify imbalances and optimize productive utilization.
Productive Utilization
Productive utilization assesses how resources are allocated and used effectively across billable, strategic, and other high-value projects. It ensures employees are engaged in activities that drive both immediate financial returns and long-term business impact, thereby maximizing workforce productivity.
The formula to calculate productive utilization is:
Project Hours) / Total Available Hours] X 100
Resource Cost Variance
Resource cost variance measures the difference between the budgeted resource cost and the actual cost incurred over a specific period. It provides organizations with clear visibility into whether projects are being executed within the project budget or drifting into cost overruns.
The formula to calculate resource cost variance is:
Cost Per Resource Unit
Cost per resource unit is a vital KPI that calculates the overall expense of utilizing one unit of a resource’s time, such as an hour, day, or month. It combines fixed costs, such as salaries and benefits, with variable costs, such as training, equipment, and overhead. This metric reveals the real cost of deploying resources.
The formula to calculate cost per resource unit is:
Units During that Period
Discover related insights into resource-cost reduction strategies for modern businesses.
Cost Per Hiring Resource
Cost per hire is a key recruitment metric that measures the total cost an organization incurs to hire a new employee. It combines external expenses, such as job advertisements, agency fees, and job portal charges, with internal costs, such as recruiter salaries, interview hours, and onboarding activities.
The formula to calculate cost per resource unit is:
Number of Hires
Skill Gap Index
The skill gap index measures the difference between the skills an organization needs to deliver existing and future projects and the current capabilities of its workforce. It helps identify critical roles or specialized skills that are in short supply, which may jeopardize project delivery, lower quality standards, or impact overall employee productivity.
The formula to calculate the skill gap index is:
Number of Skills Required] X 100
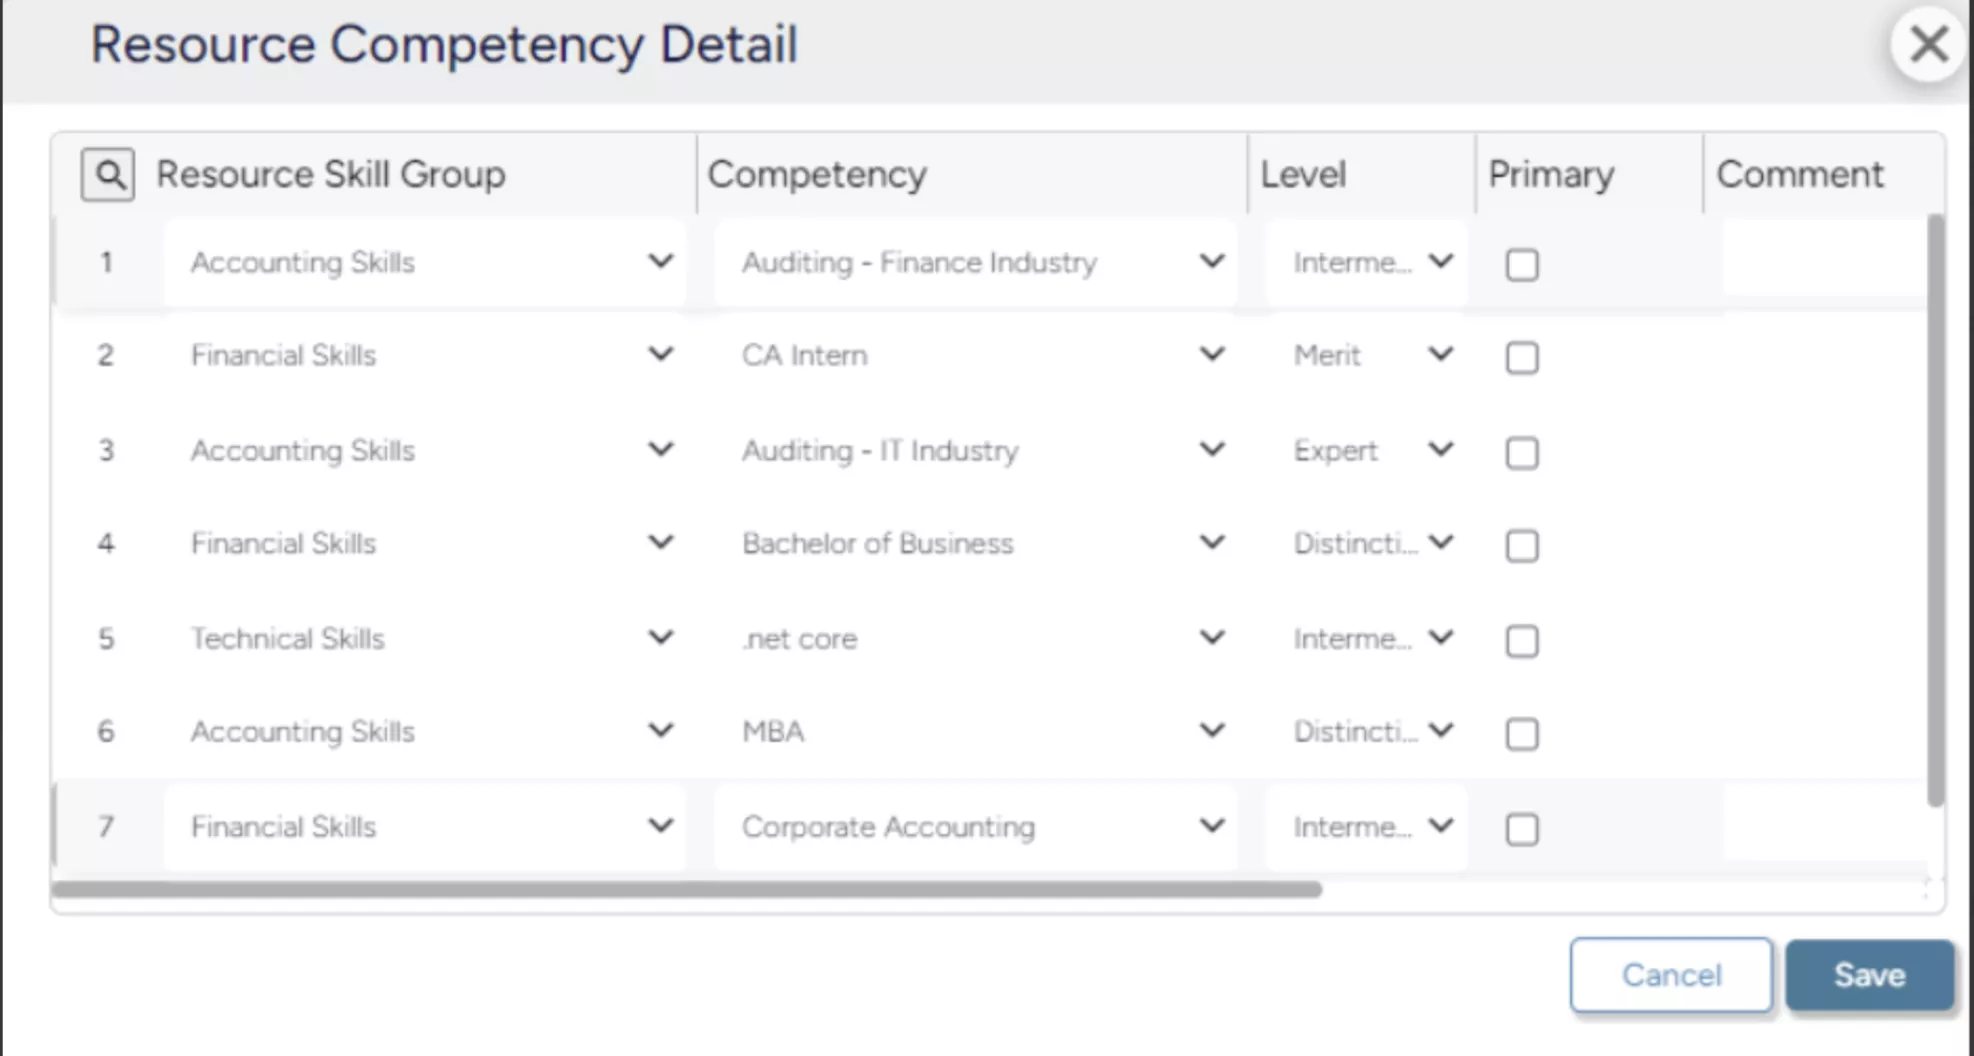 SAVIOM’s Competency Matrix provides visibility into existing skills across the organization, allowing managers to identify skill gaps and initiate targeted training and upskilling programs.
Read this blog to explore resource management and optimization in detail.
Now let’s discover how a 5th gen resource management solution can help track these metrics seamlessly.
Track and Improve Resource Management KPIs with SAVIOM
Here’s how SAVIOM helps organizations measure, analyze, and continuously improve resource management KPIs to drive better project performance and business outcomes.
Most Advanced Resource Management Solution
SAVIOM’s advanced resource management solution includes a KPI forecaster that provides organizations with real-time visibility into critical resource-centric metrics, such as utilization, availability and capacity. These insights enable managers to proactively identify inefficiencies and take corrective actions to ensure balanced workloads across teams.
Highly Configurable Dashboards and Reports
Different organizations track different KPIs based on their delivery model, billing structure, and governance needs. SAVIOM offers highly configurable dashboards and reports to define, customize, and monitor the KPIs that matter most. This ensures performance tracking reflects real operational priorities, not generic metrics.
Discover the key factors to consider while selecting a resource management software for your firm.
5th Gen Resource Management Capabilities
SAVIOM’s 5th generation resource management solution brings together advanced capabilities such as KPI forecaster, embedded capacity planner, intelligent matchmaking, early warning system, real-time BI reporting, and what-if analysis. These capabilities allow firms to advance their current maturity level, boost resource utilization, and stay ahead of the curve.
Market Leader in the Resource Management Domain
SAVIOM is trusted by Fortune 500 companies and industry leaders, including Honeywell, Fujitsu, ABB, Siemens, and FTI Consulting. Our solutions are used in 50+ countries across industries to optimize resource performance across complex project portfolios and drive business success.
Continue reading how SAVIOM ERM helps FTI Consulting schedule more than 200 employees efficiently.
Achieve a Higher Return on Investment
SAVIOM’s advanced forecasting and capacity planning help organizations identify resource gaps early and avoid expensive last-minute staffing. Moreover, skill-based allocation improves productive utilization, while automated resource requisition reduces administrative overhead. Together, these capabilities lower delivery costs, improve profit margins, and directly increase overall ROI.
Conclusion
Resource management metrics and KPIs provide organizations with the clarity needed to measure efficiency, optimize allocation, and align resources with business goals. By regularly tracking these metrics, firms can identify gaps, prevent inefficiencies, and make data-driven decisions that enhance productivity and profitability.
Frequently Asked Questions
Resource management metrics are measurable indicators used to evaluate how effectively an organization plans, allocates, and utilizes its workforce. They provide visibility into capacity, utilization, efficiency, and project performance, enabling data-driven resource planning and decision-making.
Resource management metrics are important for project performance because they provide early visibility into utilization, capacity risks, and workload imbalances. They help managers allocate resources accurately, prevent burnout, control costs, and keep projects on schedule, resulting in more predictable delivery and improved operational efficiency.
Key resource management metrics include the following:
1. Resource utilization rate
2. Resource forecast accuracy
3. Resource availability rate
4. Resource allocation effectiveness
5. Revenue per resource
6. Billable utilization
7. Forecast vs. actual time
Tracking resource management KPIs helps organizations plan realistically, anticipate future resource requirements, and address skill or capacity gaps before they impact project delivery. As a result, resource planning becomes more accurate, proactive, and aligned with both project needs and business priorities.
Resource management metrics should be reviewed regularly, weekly or monthly for operational planning, and quarterly for strategic workforce planning to ensure timely adjustments and continuous improvement.