In project-based organizations, project managers are responsible for overseeing numerous multi-faceted opportunities simultaneously. The onus is on them to review, monitor, and control every project attribute and ensure its successful delivery. However, without a clear, organized view of the project and its components, things can quickly spiral out of control. This is where a Gantt chart becomes an indispensable tool.
A Gantt chart offers a visual overview of the entire project, displaying tasks, timelines, dependencies, and resource allocations in real-time. Moreover, it provides a clear, actionable roadmap that enables project managers to track progress, adjust resource schedules as per shifting priorities, and stay ahead of potential roadblocks.
This blog explores how Gantt charts streamline project workflows, their key benefits, real-world examples, and best practices to help you manage projects effectively.
But first, let’s begin with the basics!

What is a Gantt Chart?
A Gantt Chart is a visual project management tool that represents the project schedule using a horizontal bar chart format. It involves listing project tasks or activities on the vertical axis and plotting their corresponding timelines (start and end dates) on the horizontal axis. The primary objective of a Gantt Chart is to provide a comprehensive overview of project timelines, facilitate progress tracking, and meet project deliverables effectively.
The chart comprises a task list with a horizontal bar that can slide forward or back to capture each task’s duration. The vertical axis (y-axis) shows the list of tasks or activities, while the horizontal axis (x-axis) represents time, allowing you to see when tasks start and end. It eases a project manager’s workload by representing progress made against the resource(s) explicitly assigned to execute and complete it.
Gantt Chart History
In 1896, Polish engineer Karol Adamiecki developed the first version of a Gantt Chart called the harmonogram. This chart was used to schedule tasks in factories, much like modern Gantt Charts, but due to language barriers (Adamiecki published his work in Polish and Russian), it remained largely inaccessible to English-speaking audiences.
In 1910, American engineer Henry Gantt introduced a similar but more widely recognized version of the chart in the United States. His charts were designed to track workers’ time on specific tasks in industrial settings. While Gantt’s charts are now synonymous with project management, they were built upon the foundational concepts developed by Adamiecki.
Initially, Gantt charts were drawn by hand on paper, and updates required complete redrawing of the chart. To address this, project managers began using movable paper strips or blocks to represent task durations, making it easier to update schedules without starting from scratch.
With the advent of computers in the mid-20th century, Gantt charts were digitized, enabling real-time updates and more complex project tracking. Today, Gantt charts are essential tools in industries such as construction, software development, and manufacturing, helping project managers plan, schedule, and track progress more efficiently.
Now that we know the Gantt Chart definition and history, let’s understand the importance of this tool.

What are Gantt Charts Used For?
A Gantt Chart equips you with a visual representation of each task to oversee the big picture of any project. You can use it to schedule, assign, and track project tasks from initiation to completion. It also lets you monitor the project’s progress and take necessary actions when needed.
Moreover, the Gantt chart improves cross-functional collaboration by providing a single source of truth for the entire project team. It shows who is responsible for each task, fostering greater transparency and accountability. Moreover, it helps optimize resource utilization by highlighting overloaded or underused resources.
Lastly, it enables project managers to stay forewarned of risks such as resource constraints, scope creep, and missed deadlines. Thus, Gantt charts allow them to create tailored risk management strategies proactively.
Let’s dive into the various components of a Gantt chart.
Key Elements of Gantt Chart
Each element of a Gantt Chart plays a distinct role in ensuring efficient planning and execution. Let’s have a look at them:
Task List
The task list outlines all the activities required to complete the project. Each task is further broken down into smaller, manageable sub-tasks. The tasks are usually organized by priority, indicating which ones are most critical or urgent. This can be done through numbering, color-coding, or other visual cues. Therefore, the task list helps project teams to understand what work needs to be done, by whom, and when.
Timeline and Dates
A timeline in a Gantt chart represents the overall project duration. It is displayed along the horizontal axis and is typically broken into units like days, weeks, or months. It shows when tasks start, how long they take, and when they should be completed. Dates refer to the specific start and end points of each task. The timeline and dates work together to visualize task sequencing, deadlines, and dependencies.
Task Dependencies
Task dependencies refer to the relationships between tasks in a project where the start or finish of one task relies on the completion of another. In a Gantt chart, dependencies are typically represented by arrows or lines connecting the taskbars. It allows project managers to visualize how tasks are linked and ensure the assignment progresses in a logical sequence.
SAVIOM’s Gantt Chart allows users to view and manage tasks, timelines, deliverables, and resource allocation seamlessly on a single platform
Milestones
Milestones represent critical checkpoints in the project timeline that are used to track progress, measure success, and ensure the project is on schedule. They are typically depicted as diamond-shaped symbols or markers along the project timeline without any duration (i.e., they don’t have a length like tasks do).
Read More: What are Project Milestones, and Why is it Important?
Critical Path
The critical path represents the sequence of tasks that directly determines the project’s total duration. It includes the longest path of dependent tasks, where any delay in these tasks will delay the overall project. In a Gantt chart, the critical path is often visually highlighted with a distinct color, a bold line, or markers to differentiate it from non-critical tasks.
Progress Indicators
Progress indicators are visual markers or symbols used to show the completion status of tasks over time. These indicators can include shading or coloring portions of a task’s bar to represent the percentage of work completed or secondary progress bars inside the main taskbar. Moreover, it can include symbols or markers (such as checkmarks or flags) to highlight specific milestones or checkpoints and percentage labels directly on the bars.
Resource Allocation
Resource allocation refers to the process of assigning specific resources (such as team members, equipment, or materials) to tasks within a project. In a Gantt chart, resource allocation is typically represented by displaying the assigned staff members alongside each task or within the taskbars.
Read More: What is Resource Allocation, and Why is it Important?
Now, let’s acknowledge all the benefits that Gantt Charts provide.
Benefits of Gantt Charts
To provide a clearer view of why Gantt Charts are so important in project management, here is a rundown of all the benefits of using them.
Eases Visual Depiction of Interdependent Tasks
In complex projects, many tasks are interconnected, meaning one task cannot start or finish until another is completed. Here, the Gantt chart provides a visual representation of the project timeline. This enables managers to see the start and end dates of tasks as well as their interdependencies. Therefore, it helps them understand how tasks fit together and what needs to be done next.
Read More: What Project Interdependencies Span Your Portfolio?
Helps Measure Planned Vs. Actual Results
A Gantt chart helps compare planned vs. actual results throughout the project lifecycle. It allows project managers to track task progress by comparing the scheduled start and end dates with the actual completion dates, highlighting any discrepancies or delays. This level of insight helps them maintain control over the project schedule with corrective measures and ensures timely delivery.
Provides Real-Time Scheduling Data
A Gantt Chart provides real-time visibility into the project schedule. It reflects any adjustments made in the project timeline, tasks, or resource schedules in real-time, which helps project managers and teams stay up-to-date with the latest developments. Moreover, this scheduling data helps teams respond to unforeseen challenges and minimizes the risk of project delays.
Read More: What is Project Scheduling: Examples, Benefits, and Best Practices
Generates Resource Utilization Heatmaps
Gantt chart provides a visual representation of how resources are allocated throughout the project. It helps project managers configure color-coded heatmaps wherein each shade depicts a specific range of utilization rates. Therefore, it enables project managers to promptly identify periods of over and under-utilization and implement resource optimization techniques such as leveling and smoothing to rectify the imbalance.
Improves Data-Driven Decision-Making
Gantt charts sequentially organize tasks, timelines, dependencies, and resources. It provides project managers with real-time, actionable insights that help them make informed decisions. For example, if certain tasks are falling behind, managers can use the data to quickly assess which activities need additional resources or if deadlines need to be adjusted.
Provides Seamless Project Team Collaboration
The chart serves as a centralized platform that is easily accessible to the project team. Therefore, team members can easily see what tasks are due, who is responsible for each task, and how their work depends on others. This transparency fosters cross-departmental collaboration, reduces misunderstandings, and ensures that all team members are aligned with the project’s goals.
Read More: 10 Ways to Improve Cross-Departmental Collaboration
Next, let’s look at some examples that elucidate how Gantt charts are used across industries.
Gantt Chart Examples
Gantt Charts cater to a wide range of industries, providing tailored solutions for tracking tasks, managing dependencies, and meeting deadlines. Below are specific Gantt Chart examples of how they apply to different project types:
Gantt Charts for AEC Projects
In AEC projects, Gantt charts are indispensable for managing the complex and multi-phase nature of the work. It allows project managers to track and visualize each project phase, such as design, procurement, construction, and inspection, and ensure that all tasks are completed on time and sequentially. Moreover, it helps them map out dependencies between tasks, such as how structural work must precede installations and finishing. This enables managers to prevent delays and avoid costly missteps.
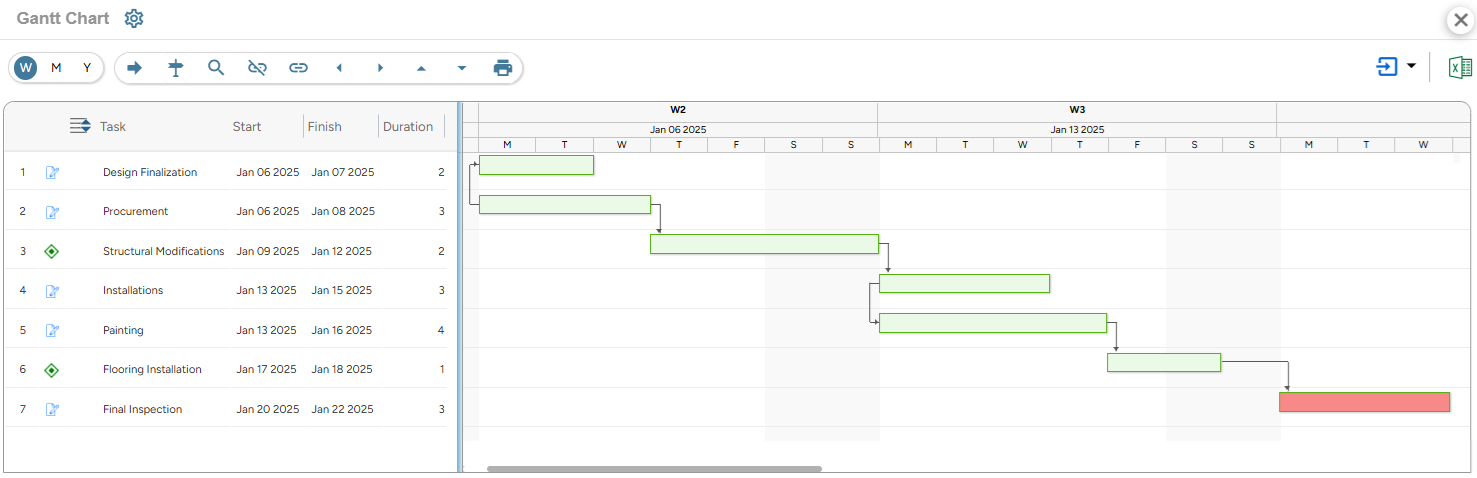
SAVIOM’s Gantt Chart helps view and track tasks and dependencies within AEC projects
Gantt Charts for Manufacturing Projects
Manufacturing projects often involve strict deadlines, quality control measures, and coordination across various departments, such as production, engineering, and inventory management. Gantt charts provide a structured way to track and manage manufacturing project lifecycles, from sourcing raw materials to assembling the final product. They provide clear timelines for each production stage, helping identify bottlenecks, optimize workflows, and minimize downtime.
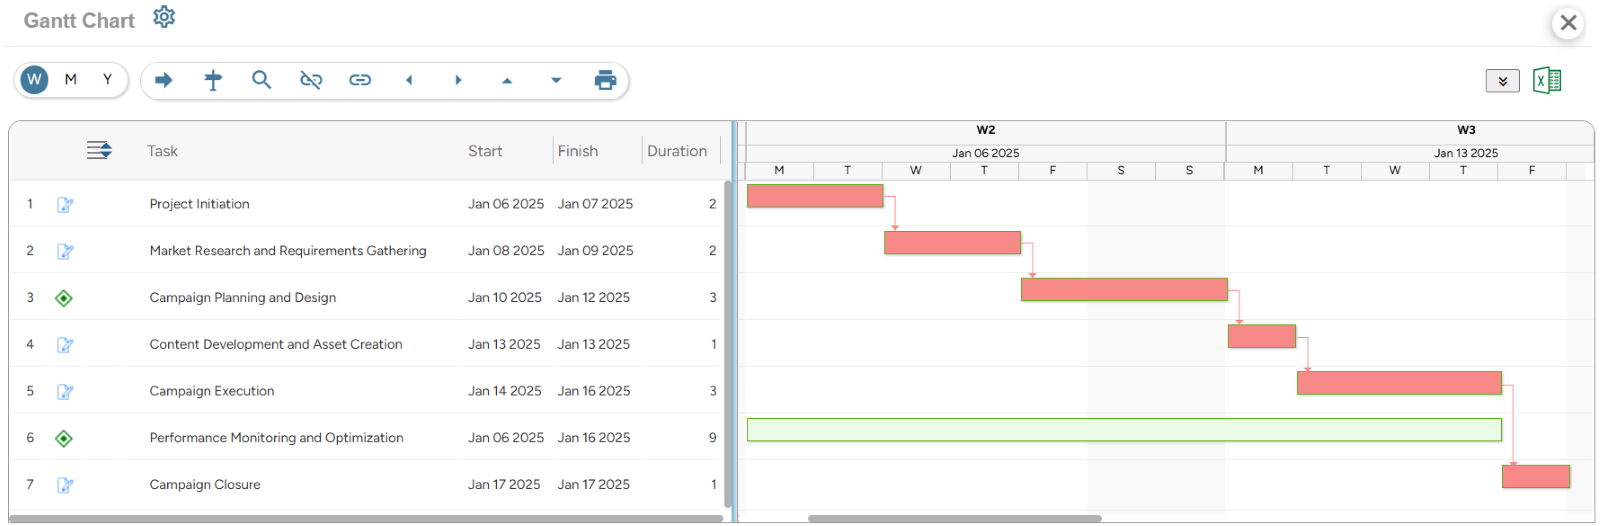
Gantt Charts for Software Development Projects
Software development involves a series of interconnected tasks such as requirement gathering, system design, coding, debugging, and quality assurance. Gantt charts help IT managers visualize the project’s timeline and monitor progress against predefined deadlines. They highlight the critical path, which ensures that tasks are completed in the right sequence. Since software projects often involve iterative cycles or sprints, Gantt charts can be adapted to reflect both long-term milestones and short-term tasks.
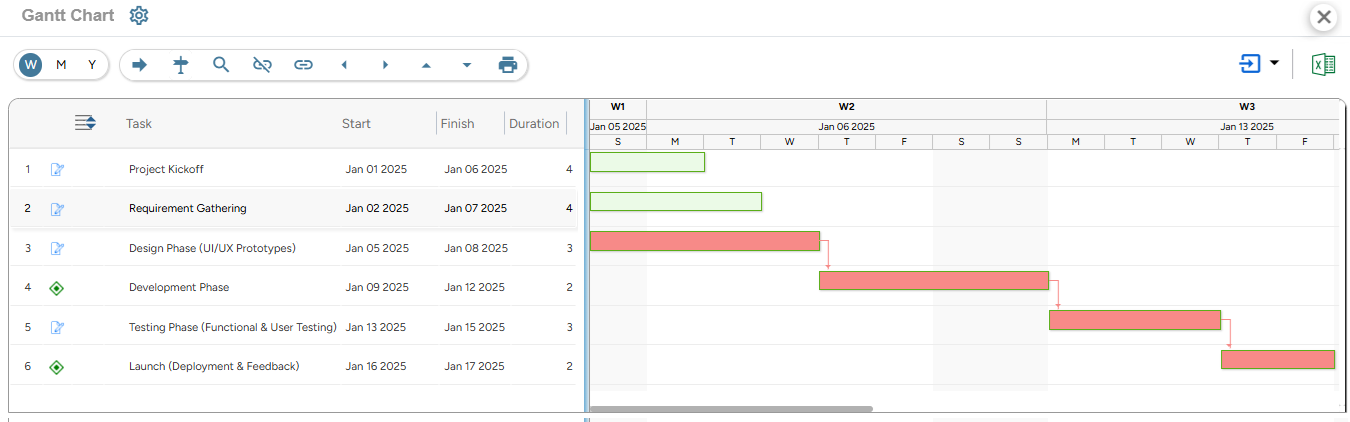
SAVIOM’s Gantt Chart enables IT managers to track the task progress of software development projects
Gantt Charts for Professional Services Projects
Professional services projects include tasks such as client meetings, research, strategy formulation, implementation, and reporting, all of which need to be managed effectively to ensure satisfactory service delivery. Gantt Charts help project managers assign roles and responsibilities, allocate time for each task, and identify dependencies between tasks. They also provide a clear overview of resource utilization, making it easier to manage consultants’ workloads and maintain quality standards throughout the project lifecycle.
Read More: 5 Effective Ways to Maximize Billable Resource Utilization in Professional Services Firms
Next, let’s explore the steps to create a Gantt Chart.
How to Create a Gantt Chart?
Gantt Charts help managers develop a graphical illustration of the schedules that help plan, coordinate, and track resources as per the tasks involved in the process. It allows them to utilize the resources at an optimal rate.
Here is how project managers can develop an effective Gantt Chart:
Define Your Project Scope
The process of creating a Gantt Chart begins by defining the project scope. This includes outlining the project’s objectives, boundaries, deliverables, and tasks. By establishing clear scope and boundaries, one can prevent scope creep and ensure that the project stays focused on its intended outcomes.
Moreover, a clear project scope serves as a roadmap and guides the creation of tasks and milestones in the Gantt Chart. Thus, it ensures that every activity is accounted for and contributes to the project’s objectives. An effective scope statement provides a reference point for evaluating progress and making informed decisions.
Create a Work Breakdown Structure
The next step is to create a work breakdown structure (WBS). A WBS divides the project into hierarchical levels of work. At the top, managers must specify the project goal. Following that, they must break down the goal into major deliverables or phases. Each of these deliverables is further divided into tasks, sub-tasks, and work packages.
For example, the main deliverable in a software development project might be “Launch Website.” This could be broken down into sub-tasks like “Design UI,” “Develop Front-end,” “Set Up Database,” and “Testing & QA.” Each of these would further be divided into even smaller tasks, such as “Create login page” under “Develop Front-end,” helping to track specific actions more effectively.
Read More: Effective Ways to Create a Work Breakdown Structure
Determine Durations & Milestones
Once your project is broken down into smaller components, the next step is determining how long each task will take. Along with the duration, project managers must include the start and end dates of every task. These estimates, subsequently, help establish the project milestones, which act as visual markers for significant events throughout the lifecycle.
For example, in a website development project, the team lead ascertains that tasks like “Design Homepage Layout” might take 3 weeks, while “Code Front-End Interface” could take 5 weeks. They set key milestones such as “Homepage Design Approval” and “Front-End Development Completion” to mark significant achievements. Therefore, by defining task durations and milestones, the project manager creates a clear structure for tracking progress and achieving project goals on time.
Establish Task Dependencies
In the next step, managers must identify the relationships between tasks and establish dependencies to create a logical workflow. These dependencies can be categorized as Finish-to-Start (FS), Start-to-Start (SS), Finish-to-Finish (FF), and Start-to-Finish (SF). In a Gantt chart, these dependencies can be represented with arrows that connect related tasks. This helps project managers understand how delay in one task can impact the timeline of other activities.
For example, in a construction project, you can’t start building walls until the foundation is complete. In a software development project, coding might need to be finished before testing can begin. Identifying these relationships between tasks is essential for a well-structured Gantt chart.
Read More: How Resource Optimization Boosts Task Management?
Find the Critical Path
Once you have established task dependencies, you can analyze them to identify the critical path. A task is considered critical if it has no slack/float or if it has start and end dates that cannot be delayed. The critical path identifies essential deadlines and the activities that must be completed on time. It helps in defining task duration and the whole project timeline.
Any delay in a critical task directly impacts the project’s overall completion date. So, by focusing on the critical path, you ensure that project delays are minimized and key deadlines are met on time. This process also highlights potential areas where additional resources or adjustments may be needed to keep the project on track.
Identify and Assign Resources to Tasks
After finding the critical path, the next step includes determining the resources required for each task, such as team members, equipment, or materials. Subsequently, they can assign responsibilities to avoid overlaps or gaps and ensure resource availability aligns with the schedule to avoid any bottlenecks and maintain consistent progress.
Additionally, by aligning the resources with the project timeline, managers can optimize efficiency and ensure that the right resources are available. Proper resource allocation also aids in balancing workloads and prevents any team members from being overburdened or underutilized.
Read More: What is Resource Scheduling? How to Schedule Resources for Projects Efficiently?
Track Progress & Make Necessary Adjustments
Once the project is underway, the Gantt chart serves as a tool for tracking progress and ensuring tasks are completed according to schedule. Therefore, it is essential to regularly review and update the Gantt chart to ensure it represents the project’s progress accurately.
Moreover, it allows project managers to compare the actual progress with the planned timeline to identify any delays or deviations early. Accordingly, they can adjust task durations, reallocate resources, or modify dependencies to bring the project back on track and ensure successful completion.
Now, let’s learn some best practices that professionals can follow to develop a well-structured Gantt chart.
Best Practices for Creating Effective Gantt Charts
Follow these best practices to design Gantt Charts that are clear, actionable, and aligned with your project’s goals –
Use Color Coding for Better Visualization
Color coding enhances the clarity of your Gantt chart by visually distinguishing different task categories, phases, or priorities. That’s why using consistent colors for similar task types makes the chart easy to read and attractive. This approach helps stakeholders quickly assess the project’s status and focus on critical areas without going through the entire chart.
Add Relevant Details to Your Tasks and Sub-Tasks
It’s important for managers to provide essential information related to each task and sub-task to avoid confusion. For that, they should include details on the chart like start and end dates, assigned resources, and key dependencies. For example, a “Develop Prototype” task might have a note indicating that it depends on the “Complete Design Phase.”
Consider Resource Availability When Assigning Them to Tasks
When assigning resources to tasks, always check their availability first to avoid conflicts or overburdening team members. Additionally, it’s essential to account for the resources’ holidays, vacations, or other commitments during project planning. Aligning resource availability with the project schedule minimizes bottlenecks, keeps progress consistent, and ensures team members aren’t overwhelmed.
Coordinate with Team Members and Stakeholders
Regular communication with your team and project stakeholders ensures the Gantt Chart reflects real-time progress and constraints. For that, managers should share the initial draft for feedback and adjust timelines, resources, or priorities based on the inputs from stakeholders. Further, the chart should be continuously updated during the project, and changes should be discussed during team meetings.
Read More: Who are Project Stakeholders, and How to Manage Them Efficiently?
Now, let’s have a look at how robust project management software can prove beneficial to Gantt chart.
How Can Project Resource Management Software Help?
Most project resource management software are equipped with Gantt charts, which help streamline project planning and tracking. Furthermore, it offers additional features that help managers optimize the project lifecycle. Let’s take a look at these features:
- 360-Degree Resource Visibility: It offers insights into key resource attributes such as skills, qualifications, availability, and costs. This helps identify and assign the right resources to the project.
- Gantt Chart: The Gantt chart allows managers to create WBS, establish dependencies, set milestones, and assign resources to specific tasks. It displays the start and end dates of tasks, which allows project managers to track progress.
- Real-time Utilization Tracking: The tool provides color-coded heatmaps which allows managers to address over/underutilization of resources and take corrective measures.
- Real-time BI Reports: The tool offers reports like the forecast vs. actual time, cost, and utilization to compare the results throughout the project lifecycle and make necessary adjustments.
Conclusion
Gantt Charts have been in existence for hundreds of years and have served several thousands of projects. There’s a simple reason for its popularity- it visually depicts time-sensitive tasks, activities, and events to get the project delivered in the shortest duration possible.
The chart is interesting to experienced and newly qualified project professionals alike. Given that the right resources prevent cost overruns and delays, playing around with a Gantt Chart template gives you a fair idea of how resource and project schedules should stick to the plan.
So, are you ready to visualize project timelines and stay ahead of deadlines?
The Glossary
Read More: Glossary of Resource Workforce Planning, Scheduling and Management